 Apartment List Research Team is rewinding 2022 to predict 2023 apartment market. Since 2020, the rental market has been on a roller coaster ride, characterized by abrupt swings. That ride continued in 2022, but this year also brought with it a slow return to normalcy in the market, as rent growth cooled and inventory opened back up. And for the past several months now, rents have been dipping, a modest sign of relief for renters who have been squeezed by both skyrocketing housing costs and non-housing inflation.
Looking ahead to 2023, there’s still significant uncertainty about what the economy has in store, but there’s good reason to believe that renters will have more bargaining power than they have in years. As we close out the year, the Apartment List research team has rounded up our summary of the key rental market trends that defined 2022 and those that we expect to define 2023.
3 Key National Trends
1. Rent growth comes back to earth
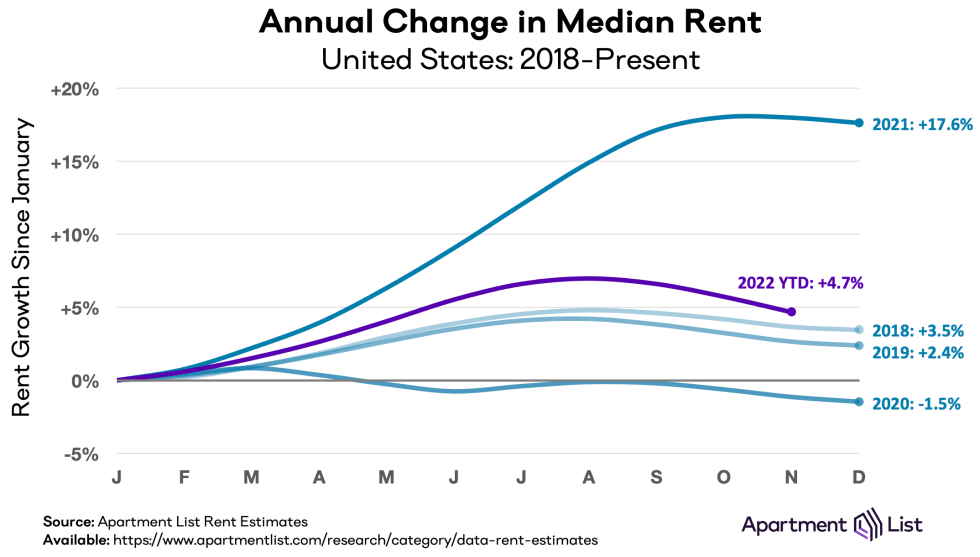
2021 shattered the record for the fastest growth in the history of our national rent index (which goes back to 2017). The median rent nationwide increased by a staggering 17.6 percent, from $1,099 in January to $1,293 in December.
While the market remained hot heading into the start of this year, such extreme levels of rent growth were not sustainable. In the first six months of 2022, rents increased by 5.5 percent nationally, a growth rate that represented a notable slowdown from the 2021 pace, but remained well ahead of the pre-pandemic norm.
But in the back half of this year, rent growth has cooled even further, and apartment prices have now actually been falling since August. It’s typical to see a dip in rents in the fall and winter, when fewer renters are looking to move, but it appears the recent decline is reflecting more than just seasonality.
From August to November, our national rent index had the sharpest three-month decline in its history. As of November, our national index is now showing rent growth of 4.7 percent over the course of 2022, with the national median rent now standing at $1,356. Our estimates for December aren’t yet available, but we’re expecting to see this decline continue, and year-end rent growth for 2022 will likely come in below 4 percent; this is close to the moderate level of growth we saw in 2018 and less than one-quarter of last year’s growth. 2022 marked the end of a prolonged period of astronomical rent growth.
2. More options for renters
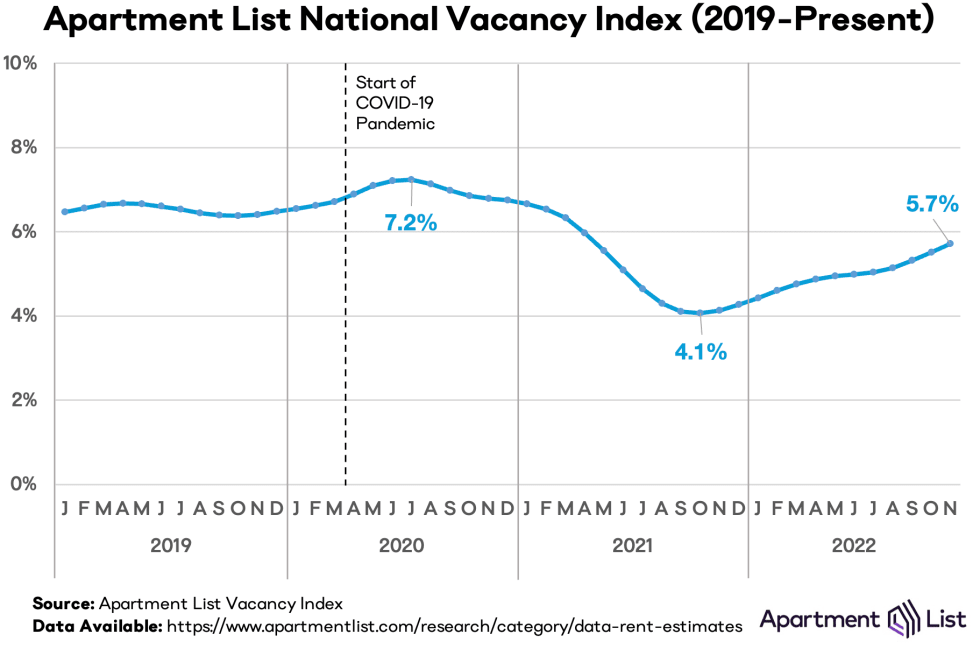
The slowdown in rent growth described above is being driven by shifts on both the supply and demand sides of the market. On the supply side, this shows up as an increasing number of units available to rent, as reflected in our rental vacancy index. This index represents the number of vacant units listed for rent in any given month on Apartment List as a share of the total number of units in those properties.
Over the course of 2021, our vacancy index declined sharply as more renters were competing for fewer units, bottoming out at 4.1 percent last October. But over the course of 2022, this index has been steadily ticking back up, meaning that more supply has been coming available. These increases in supply are attributable to slowing household formation (see below), combined with more new apartment inventory hitting the market as multifamily construction pipelines have begun to recover from pandemic-related disruptions.
In recent months, the rate of supply easing has picked up steam, and as of November, our national vacancy index stands at 5.7 percent. This is still below the pre-pandemic norm, which hovered between 6 and 7 percent, but given the way things have been going, we could hit those levels again by spring. For renters looking to move, this means they should now see more options and less competition than at the outset of this year.
On the demand side of the rental market equation, 2022 saw a major slowdown in the number of new households looking for a place to live. The chart below shows the total number of households in the U.S., as measured by the Census Bureau’s monthly Current Population Survey. This metric includes both renter and homeowner households, but the two move in tandem, so this data is a valuable proxy for rental demand.
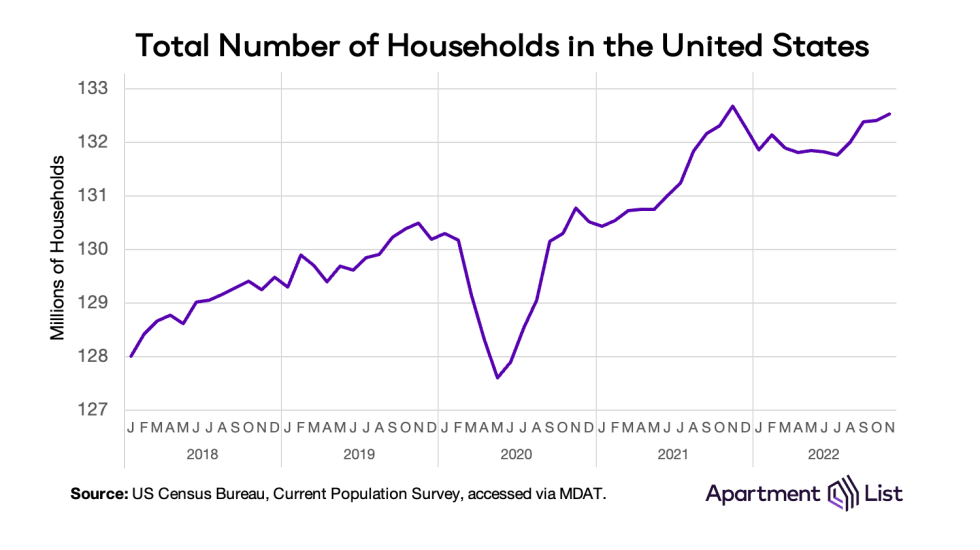
In the early months of the pandemic in 2020, there was a sharp contraction in the number of households, as many younger Americans and those experiencing unemployment gave up their leases and moved in with family or friends to save on housing costs as they waited out the pandemic. But by late 2020, most of these households had re-formed, and that was followed by a surge in new households in 2021, as Gen Z struck out on their own and roommate households broke apart to find their own places. In just a year and a half, the number of households in the U.S. increased by more than 5 million, from a pandemic low of 127.7 million, to a peak of 132.7 million in November 2021.
However, in 2022, new household formation has been relatively flat. As of last month, the total number of households stood at 132.5 million, down by 143,000 compared to last year’s peak. It appears that renters are exhibiting much more caution in striking out on their own, as higher housing costs and general inflation have eroded their budgets, and as fears of a potential 2023 recession loom large in the public’s economic sentiment.
3 Key Regional Trends
1. The Sun Belt boom stalls out as the Midwest picks up steam
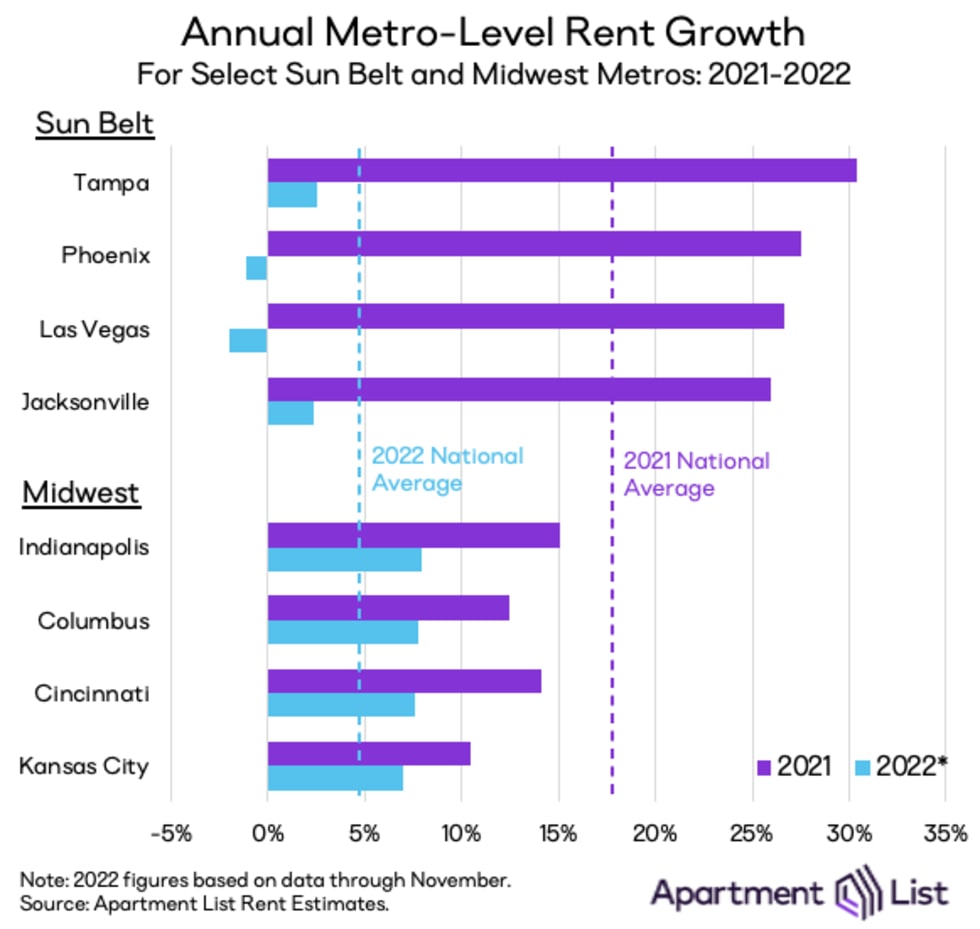
While the sections above paint a broad picture of the national rental market landscape, these trends are highly localized and vary significantly by market. Last year, rental pricing was up significantly across the nation, but the Sun Belt, in particular, saw the most disruption. All of the 10 metros with the fastest rent growth in 2021 were located in Sun Belt states. This year, however, rent growth in these markets has cooled significantly.
Take the examples below – the Tampa metro had the nation’s fastest rent growth last year, with rents up by 30.4 percent, while Phoenix, Las Vegas, and Jacksonville all ranked in the top 10, with prices up by 25 percent or more. This year, however, none of these markets has seen rents increase by more than 2 percent. Las Vegas and Phoenix have actually seen prices fall year-over-year, ranking one and two for slowest rent growth. It seems that with surging prices having eroded the affordability advantage that these markets once offered, moves to the Sun Belt have dropped off dramatically.
At the same time, we’re seeing signs of demand heating up in a number of Midwestern markets. The St. Louis, Indianapolis, Kansas City, and Cincinnati metros all rank among the top 10 for fastest rent growth in 2022. Rent growth in each of the markets has been slower this year than it was last year, but this is largely reflective of the broad cooldown in the national rental market as a whole.
If we compare the growth of these markets to the national average, they have all shifted from having below-average rent growth in 2021 to above-average rent growth in 2022. After the spike in Sun Belt rents, the Midwest may now be the nation’s last bastion of rental affordability, and seems to be drawing interest from price-conscious and geographically flexible renters.
2. Early pandemic price convergence is still holding
Despite this year’s flattening rent growth in the Sun Belt, these markets continue to dominate the list of fastest growth when measured over the full period since the start of the pandemic in March 2020. In contrast, the markets with the slowest rent growth over that period are largely expensive coastal markets where prices fell dramatically in the first year of the pandemic.
In other words, pandemic-era rent growth has been correlated with pre-pandemic rent prices, with affordable cities tending to see faster rent growth and more expensive ones tending to experience slower growth. This can be seen in the animated visualization below, which shows how much rent prices have changed from March 2020 through November 2022 for each of the 500 largest cities included in our rent estimates.
In the first year of the pandemic, a downward-sloping trend emerges, representing the correlation between affordability and growth described above. Even as prices tended to rise across the board in 2021, this trend held, and that has continued in 2022 as prices have leveled off. Because of this divergence in rent growth, the price gap between the nation’s most expensive cities and its most affordable ones has narrowed.
Take, for example, San Francisco and Phoenix – in March 2020, the median rent in San Francisco ($2,556) was 2.5 times greater than that of Phoenix ($1,013); as of November 2022, that gap has narrowed to 1.6 times ($2,308 vs $1,421). This price convergence can be seen most clearly in Sun Belt cities, but as described above, this trend may now be extending to the Midwest as well.
3. The suburban boom continues
In addition to the cross-metro variation described above, this year also saw a continuing trend of shifting demand within metros. Specifically, it continues to be the case that among the nation’s large metro areas, rent growth in the suburbs is outpacing that of the downtown areas.
In the years preceding the pandemic, rent prices in the suburbs of large metros were growing at roughly the same pace as the core cities of those metros, on average. This changed abruptly in 2020 when remote work and social distancing made urban living less attractive, and demand shifted to the more affordable and spacious suburbs. In the first year of the pandemic, the median rents in the core cities of major metros fell by an average of 5.2 percent, while the suburbs continued to see prices rise. In particular, the farthest flung suburbs – those sitting more than 30 miles from the urban core – saw prices rise most quickly, increasing by 4.8 percent in the first year of the pandemic.
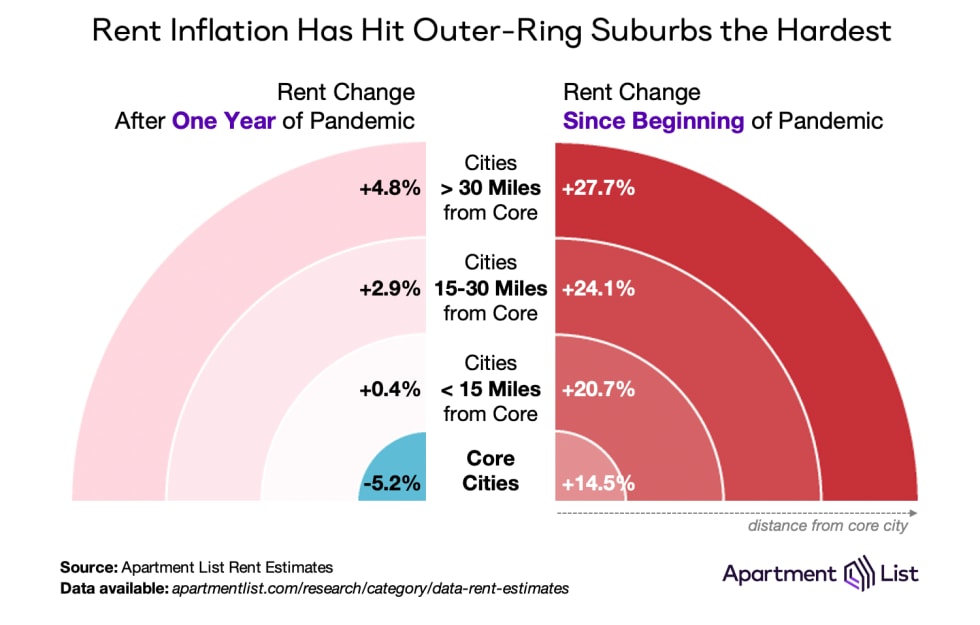
In the time since, rent prices in densely populated urban areas have bounced back, but the rent growth gap between core cities and suburbs has yet to close. From March 2020 through November 2022, the core cities of the nation’s large metro areas have seen prices rise by a total of 14.5 percent, on average. Over that same period, prices are up by 20.7 percent in the closest suburbs, 24.1 percent in the mid-distance suburbs, and 27.7 percent in the furthest suburbs.
In other words, the further you move from the urban core, the faster the rent growth. With many workers retaining at least hybrid remote flexibility, proximity to job centers has grown relatively less important, and this has driven a shift in preferences that continues to persist.
3 Key Themes for 2023
1. Renters back in the driver’s seat
Looking ahead to next year, we expect that the most notable trend in the rental market will be a shift in bargaining power away from property owners and back to renters. This shift already appears to be underway, as evidenced by the recent declines in the national median rent. The factors that have driven that dip – namely, cooling demand colliding with rising inventory – are likely to persist into next year.
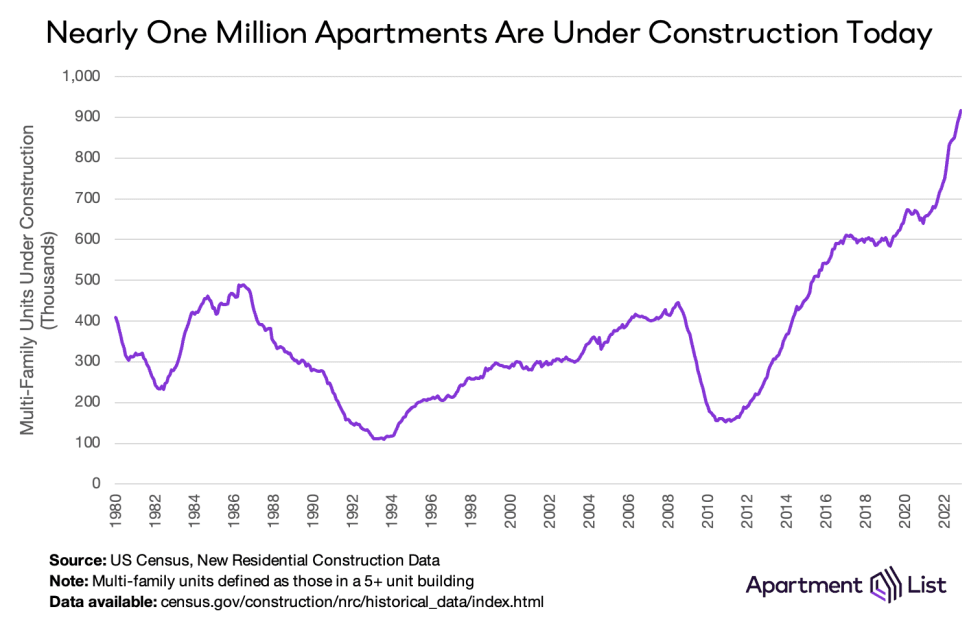
Confidence in the economy is currently shaky at best, with many fearing a possible recession in the coming year. This is causing renters to exhibit more caution in taking on new expenses, translating to slower household formation and fewer upgrade moves. At the same time, the multifamily construction pipeline is roaring – there are currently more multifamily units under construction than at any point since 1980. As these projects are completed and new inventory hits the market in 2023, a growing number of properties with vacant units to fill will be fighting for a smaller number of renters looking to move.
This shift in supply and demand dynamics is likely to result in the continuation of subdued rent growth. The price declines that we’ve seen recently are partly seasonal in nature, and are unlikely to persist throughout 2023, but it’s also unlikely that we’ll see significant price increases. Currently, it seems most likely that 2023 will be a year of flat to modest rent growth. We’ll also likely see the return of properties offering rent specials and concessions to lure in renters.
All that said, it’s important to note that the trajectory of the market next year is largely dependent on broader macroeconomic conditions. If the economy were to experience a recession next year, it’s possible that rents could decline meaningfully (though even then, it’s highly unlikely that we’d see anything close to a return to 2020 rent levels). On the other hand, there have been recent signs that inflation is abating while the labor market remains fairly strong. If renter confidence bounces back and demand improves, rent growth could be faster than anticipated.
2. Remote work faces its biggest test
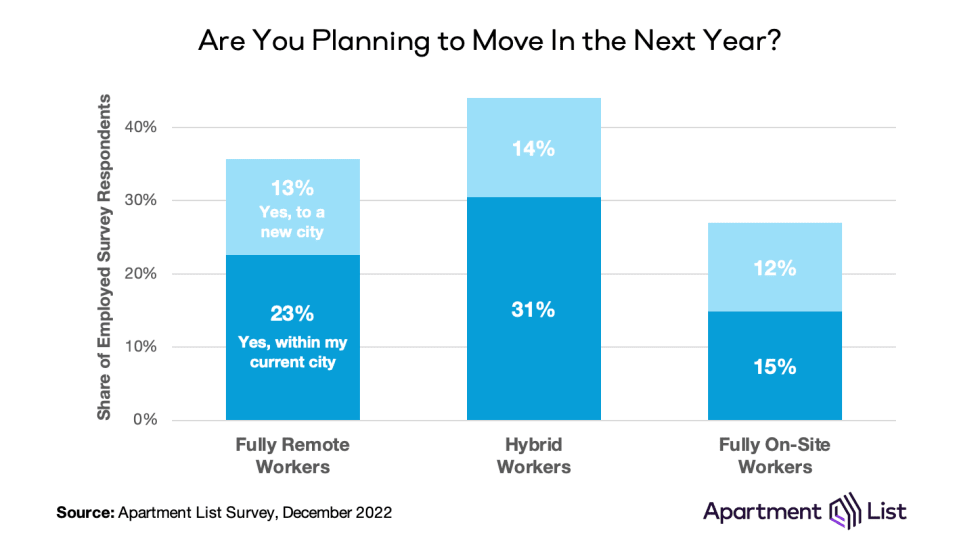
In 2023, we’ll also have our eye on the next chapter of the remote work revolution. The increased geographic flexibility afforded by remote work has been an important factor in a number of the rental trends we explored above, particularly the demand shifts from high-cost to low-cost metros and from urban to suburban areas. Even as many workers returned to the office this year, remote work remains prevalent, especially hybrid arrangements. Recent research suggests that 29 percent of workers currently have hybrid working arrangements in which they work from home on some days and go into the office on others, while 13 percent of employees work entirely from home.
If these levels of remote work persist in the long term, it could have significant implications for the housing market. Hybrid workers are still tied to their job location, but if their commutes are less frequent, they may expand the radius of locations where they’re willing to live. And even if full remote arrangements are the minority, they are still much more prevalent than they were three years ago. In a recent survey, 44 percent of workers with full or hybrid remote flexibility told us that they’re planning to move in the upcoming year, compared to just 28 percent of on-site workers. These stated plans are almost certainly an overstatement of the number of moves that will actually take place, but the stark divide between remote and on-site workers indicates that remote work is indeed spurring greater geographic mobility.
In 2023, it is also likely that many employers will more fully formalize their long-term plans for how they approach remote work. As office leases expire, many companies may significantly downsize their footprints and redesign their spaces to better suit a hybrid workforce. This would have significant implications for the commercial real estate market, as well as the broader economic outlook for the central business districts of major cities.
However, it’s also possible that in the case of a recession or even just a weakening of the labor market, executives who are skeptical of remote work could leverage increased bargaining power to force workers back to the office full time. In any case, by the end of 2023, we should have a clearer picture of the long-term future of remote work and its implications for housing.
3. Official estimates of housing inflation will reflect the cooling that our index has long been showing
The 2023 prediction that we have perhaps the highest confidence in is related to the highest profile economic storyline of 2022 – inflation. As we’ve noted throughout this report, our rent estimates have shown that the market has been consistently cooling off throughout the past year. However, the measure of rent growth utilized by the Bureau of Labor Statistics in their official CPI inflation estimates has actually been heating up throughout 2022. The year-over-year growth rate of our index fell from 17.9 percent in January to 4.6 percent in November, while BLS’s measure of rent growth increased from 3.8 percent in January to 7.9 percent in November.
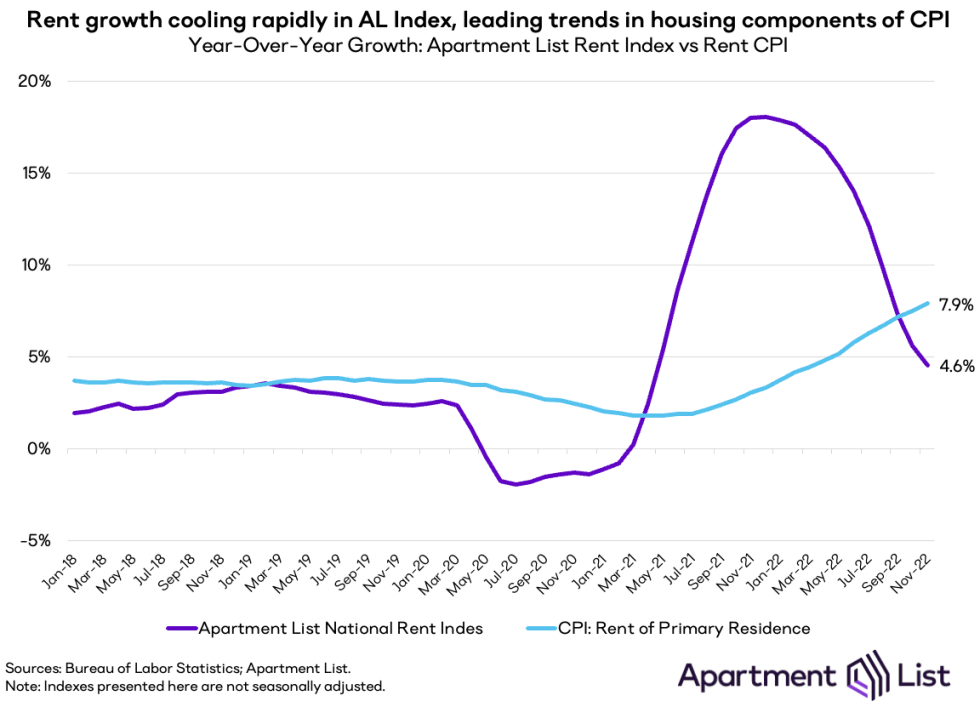
While this may seem counter-intuitive, it’s really just a reflection of the two indexes simply measuring different things. Our index measures price changes for new leases, whereas the CPI measures changes across all households. Because only a small share of households move in any given month, price changes filter into CPI much more slowly and gradually, meaning that our index serves as a leading indicator for the housing components of CPI.
Based on this lag, we expect that the official measure of housing inflation will turn a corner in the first half of 2023 and begin to gradually fall. Thankfully, the topline inflation numbers have already started to cool off, even with the housing component still keeping CPI propped up. Next year, when the CPI’s housing measure begins to reflect the rapid cooldown in the rental market that we see in our index, it should contribute to further moderation of inflation overall.
Conclusion
As we close out the year and look ahead to 2023, the rental market is showing some positive signs for renters. Rent prices are now dipping after a year and a half of record-setting growth. And with a record number of new apartment units in the construction pipeline, 2023 will bring more options for renters than they’ve had in years. As new supply meets cooling demand, renters may finally have the upper hand in the market, while property owners will be the ones competing to fill their vacancies.
That said, the broader macroeconomic environment remains somewhat uncertain, and that backdrop will be a key factor in determining the trajectory of the rental market in the coming year. We hope this recap leaves you more informed heading into next year. The Apartment List Research team wishes you all the best for the holiday season and the new year!
 TUCSON, ARIZONA (December 23, 2022) — HSL Gladden Farms Crossroads Block 3, LLC an affiliate of HSL Properties, Inc. of Tucson (Omar Mireles, President) closed on +/- 22 acres known as Block 3 of The Crossroads at Gladden specific plan in Marana. The purchase price was $6,349,058 ($288,594 per acre).
 TUCSON, ARIZONA (December 23, 2022) — In 2006, voters of Pima County overwhelmingly approved the Regional Transportation Authority’s 20-year regional transportation plan and a countywide half-cent (excise) sales tax to fund it.