 Cash Sales Pull Back From Previous Month, Still Represent 44 Percent of Total Sales Institutional Investor Purchases Plummet Nationwide
IRVINE, Calif. – Nov. 25, 2013 — RealtyTrac® (www.realtytrac.com), the nation’s leading source for comprehensive housing data, released its October 2013 U.S. Residential & Foreclosure Sales Report, which shows that U.S. residential properties, including single family homes, condominiums and townhomes, sold at an estimated annualized pace of 5,649,965, a 2% increase from the previous month and up 13% from October 2012.
Despite the nationwide increase, home sales continued to decrease on an annual basis for the third consecutive month in three bellwether western states: California (down 15% from a year ago), Arizona (down 13%), and Nevada (down 5%).
The national median sales price of all residential properties — including both distressed and non-distressed sales — was $170,000, unchanged from September but up 6% from October 2012, the 18th consecutive month median home prices have increased on an annualized basis.
The median price of a distressed residential property — in foreclosure or bank owned — was $110,000 in October, 41% below the median price of $185,000 for a non-distressed property.

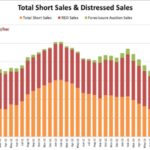
“After a surge in short sales in late 2011 and early 2012, the favored disposition method for distressed properties is shifting back toward the more traditional foreclosure auction sales and bank-owned sales,” said Daren Blomquist,vice president at RealtyTrac. “The combination of rapidly rising home prices — along with strong demand from institutional investors and other cash buyers able to buy at the public foreclosure auction or an as-is REO home — means short sales are becoming less favorable for lenders.”
Other high-level findings from the report:
- October residential short sales represented 5.3% of all sales, down from 6.3% in the previous month and down from 11.2% in October 2012 (see important note below on changes to short sale methodology).
- States with the highest percentage of short sales in October included Nevada (14.2%), Florida (13.6%), Maryland (8.2%), Michigan (6.7%), and Illinois (6.2%).
- Foreclosure auction sales to third parties — a new category separated out in the report for the first time in October— represented 2.5% of all sales, down from 2.8% in the previous month but nearly twice the 1.3% in October 2012.
- Markets with the highest percentage of foreclosure auction sales included Orlando (8.6%), Jacksonville, Fla., (8.6%), Columbia, S.C. (8.1%), Las Vegas (6.6%), Charlotte (6.1%), Miami (6.0%), and Tampa (5.7%).
- REO sales accounted for 9.6% of all sales, up from 8.9% in September and up from 9.4% in October 2012.
- Markets with highest percentage of REO sales included Stockton, Calif., (24.4%), Las Vegas (23.8%), Cleveland (22.3%), Riverside-San Bernardino, Calif., (20.1%), Detroit (18.8%) and Phoenix (18.0%).
- Cash sales represented 44.2% of all residential sales in October, down from a revised 45.0% in September but up from 33.9% in October 2012.
- States with percentage of cash sales above the national average included Florida (65.6%), Nevada (55.5%), Georgia (55.4%), South Carolina (53.9%), North Carolina (49.9%), Michigan (49.5%) and Ohio (49.2%).
- Institutional investor purchases represented 6.8% of all sales in October, a sharp drop from a revised 12.1% in September and down from 9.7% a year ago.
- Markets with the highest percentage of institutional investor purchases included Memphis (25.4%), Atlanta (23.0%), Jacksonville, Fla., (22.2%), Charlotte (14.5%), and Milwaukee (12.0%).
- Markets with biggest increase in median home price included Detroit (up 38%), San Francisco (up 32%), Sacramento (up 30%), Atlanta (up 30%), and Jacksonville, Fla. (up 29%).

Report methodology
The RealtyTrac U.S. Residential Sales Report provides counts and median prices for sales of residential properties nationwide, by state and metropolitan statistical areas with a population of 500,000 or more. Data is also available at the county level upon request. The report also provides a breakdown of cash sales, institutional investor sales, short sales, bank-owned sales and foreclosure auction sales to third parties. The data is derived from recorded sales deeds and loan data, which is used to determine cash sales and short sales. Sales counts for recent months are projected based on seasonality and expected number of sales records for those months that are not yet available from public record sources but will be in the future given historical patterns. Statistics for previous months are revised when each new monthly report is issued as more deed data becomes available for those previous months.
Important methodology note: Starting with this October report, RealtyTrac has adjusted the methodology for the report as it concerns short sales — now applying a refined calculation to take into account the true loan balance secured by a home at the time of the sale, and additionally separating out of the short sale classification properties that sell at the public foreclosure auction short of the loan balance.
Related to this second change, RealtyTrac is now including a new category of distressed sale in the report: third-party foreclosure auction sales, which represent sales at the public foreclosure auction to third parties other than the foreclosing lender.
 This article has been archived, please login for access or subscribe now by going to the subscribe tab at the top of page.