CBRE: Phoenix Industrial Market Rebounds in Q1 as Absorption Surges and Vacancy Retreats
 PHOENIX, AZ (April 10, 2026) — Phoenix’s industrial market posted one of its strongest quarters in three years to open 2026, with net absorption surging to 4.9 million square feet, deliveries slowing sharply, and vacancy beginning to retreat after a supply heavy reset in 2025.
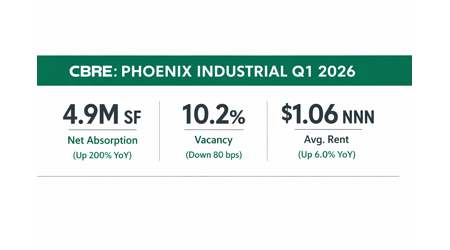
New figures from CBRE show first-quarter net absorption climbed 200 percent year over year and 40.9 percent from the prior quarter, signaling a sharp return in demand across the metro. At the same time, only 1.4 million square feet were delivered in Q1, the lightest quarterly delivery volume since Q1 2019, helping tighten market conditions. Vacancy fell 80 basis points from the fourth quarter to 10.2 percent, reversing the spike that followed the wave of new supply delivered over the last several years.
The quarter also marked an important milestone for big-box logistics space in metro Phoenix. CBRE reported that more than 15 million square feet of gross absorption were recorded during the quarter, including three new leases of more than 1 million square feet each. By quarter’s end, there were no remaining available blocks of 1 million square feet or more on the market.
That shift reflects both stronger leasing momentum and the market’s ability to work through the large inventory buildout that pushed vacancies higher. Since Q1 2022, more than 107 million square feet have been delivered across the metro, while about 75 million square feet have been absorbed. Now, with deliveries slowing and demand strengthening, the balance is beginning to move back toward stabilization.
Pricing also continued to be firm. Average asking rents rose to $1.06 NNN per square foot, up 1.9 percent from the prior quarter and 6.0 percent year over year. According to CBRE, Phoenix had never seen industrial NNN asking rents exceed $1.00 before 2022, and the market is not projected to fall back below that threshold.
The Southwest Valley remained the engine of activity in Q1, accounting for 5.97 million square feet of net absorption and 10.7 million square feet of gross absorption, far outpacing every other submarket. The Southeast Valley also remained active, while the Airport Area and Northwest Valley posted negative net absorption for the quarter. Among submarkets, the Northeast Valley had the lowest overall vacancy at 6.8 percent, followed closely by the Airport Area at 7.0 percent. Southeast Valley posted the highest vacancy at 14.2 percent.
Large-format distribution space led the quarter’s gains. CBRE said the distribution product segment accounted for 5.1 million square feet of net absorption, while the 300,000-square-foot-and-larger segment recorded 5.1 million square feet of absorption, underscoring continued demand from major users. Key transactions included new leases by Amazon.com for 1.063 million square feet, DHL for 1.031 million square feet and another 630,000 square feet, and LG Energy Solution for 597,000 square feet, all in the Southwest Valley.
Even with the quarter’s tightening, development has not stopped. The metro still had nearly 14.0 million square feet under construction at the end of Q1, up 38.2 percent from the previous quarter. About 26 percent of that pipeline is preleased or build-to-suit, suggesting that new construction is being driven less by speculation and more by identified user demand. Major projects underway include the 1.3 million-square-foot LG Energy Battery Manufacturing Facility, the 1.2 million-square-foot Northern Parkway Logistics Center Building D, and the 1.1 million-square-foot VT303 North.
Taken together, the first-quarter numbers suggest Phoenix Industrial has moved beyond the peak of its supply-driven correction and is entering a more disciplined phase, one supported by renewed tenant demand, a smaller flow of new deliveries, and continued rent stability above the $1.00 mark.
Read the full report here: Phoenix Industrial 2026 Q1 Figures