 TUCSON, ARIZONA — Apartment List is reporting Tucson rents increased 0.6% month-over-month, compared to a 0.6% decrease nationally. Month-over-month growth in Tucson ranks #44 among the nation’s 100 largest cities. Year-over-year rent growth in Tucson currently stands at 21.7%, compared to 7.8% at this time last year. Year-over-year growth in Tucson ranks #23 among the nation’s 100 largest cities. Rents in Tucson are up by 30.4% since the start of the pandemic in March 2020. Median rents in Tucson currently stand at $1,020 for a 1-bedroom apartment and $1,363 for a two-bedroom.
Tucson rents increase sharply over the past month
Tucson rents have increased 0.6% over the past month, and have increased sharply by 21.7% in comparison to the same time last year. Currently, median rents in Tucson stand at $1,020 for a one-bedroom apartment and $1,363 for a two-bedroom. The city’s rents have been increasing for 21 straight months – the last time rents declined was in May 2020. Tucson’s year-over-year rent growth lags the state average of 26.3%, but exceeds the national average of 17.6%.
Rents rising across cities in Arizona
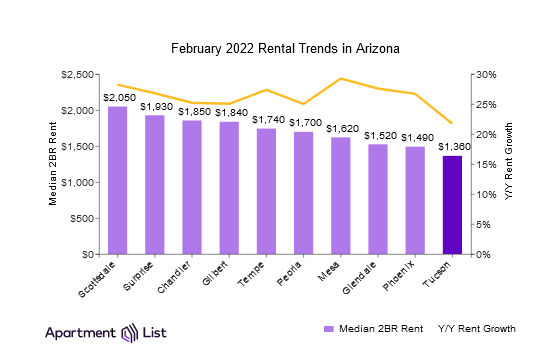
Throughout the past year, rent increases have been occurring not just in the city of Tucson, but across the entire state. Of the largest 10 cities that we have data for in Arizona, all of them have seen prices rise. The state as a whole logged rent growth of 26.3% over the past year. Here’s a look at how rents compare across some of the largest cities in the state.
- Looking throughout the state, Scottsdale is the most expensive of all Arizona’s major cities, with a median two-bedroom rent of $2,048; of the 10 largest Arizona cities that we have data for, all have seen rents rise year-over-year, with Mesa experiencing the fastest growth (+29.3%).
- Scottsdale, Glendale, and Tempe have all experienced year-over-year growth above the state average (28.2%, 27.6%, and 27.4%, respectively).
Tucson rents more affordable than many other large cities nationwide
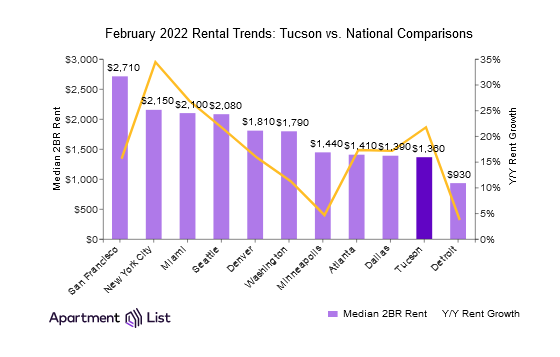
As rents have increased sharply in Tucson, a few comparable cities nationwide have seen rents grow more modestly. Tucson is still more affordable than most similar cities across the country.
- Tucson’s median two-bedroom rent of $1,363 is above the national average of $1,294. Nationwide, rents have grown by 17.6% over the past year compared to the 21.7% increase in Tucson.
- While Tucson’s rents rose sharply over the past year, many cities nationwide also saw increases, including New York City (+34.4%), Miami (+26.9%), and Seattle (+21.5%).
- Renters will find more reasonable prices in Tucson than most comparable cities. For example, San Francisco has a median 2BR rent of $2,711, which is nearly twice the price in Tucson.
For more information check out our national report. You can also access our full data for cities and counties across the U.S.
Methodology – Recent Updates:
Data from private listing sites, including our own, tends to skew toward luxury apartments, which introduces sample bias when estimates are calculated directly from these listings. To address these limitations, we’ve recently made major updates to our methodology, which we believe have greatly improved the accuracy and reliability of our estimates.
Read more about our new methodology below, or see a more detailed post about the methodology on our blog.
Methodology:
Apartment List is committed to making our rent estimates the best and most accurate available. To do this, we start with reliable median rent statistics from the Census Bureau, then extrapolate them forward to the current month using a growth rate calculated from our listing data. In doing so, we use a same-unit analysis similar to Case-Shiller’s approach, comparing only units that are available across both time periods to provide an accurate picture of rent growth in cities across the country.
Our approach corrects for the sample bias inherent in other private sources, producing results that are much closer to statistics published by the Census Bureau and HUD. Our methodology also allows us to construct a picture of rent growth over an extended period of time, with estimates that are updated each month.
Read more about our methodology.
 GOODYEAR, Arizona – Marcus & Millichap (NYSE: MMI), a leading commercial real estate brokerage firm specializing in investment sales, financing, research and advisory services, announced today the sale of Brakes Plus, a 5,148-square-foot net-leased property located in Goodyear, Arizona.
 By
By 