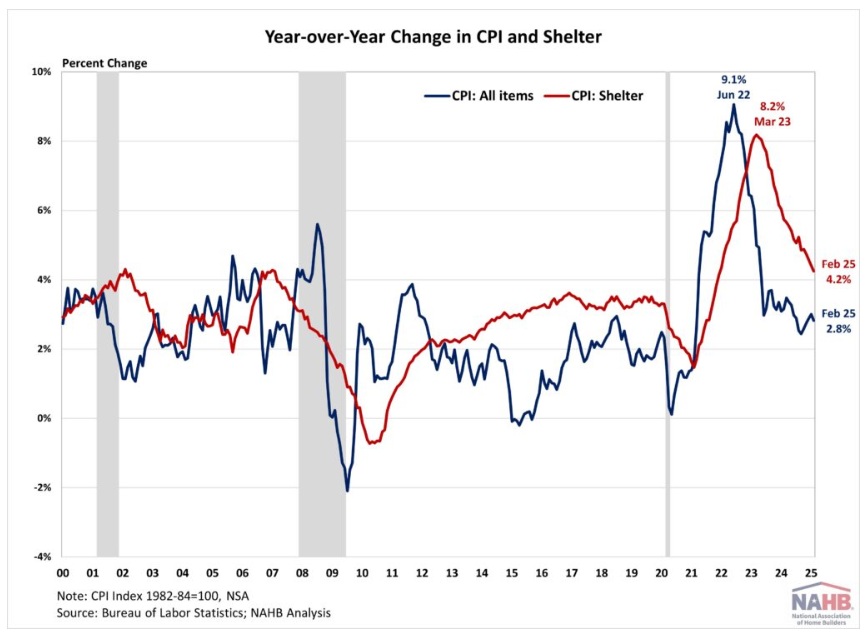
 (March 13, 2025) — The National Association of Home Builders reports inflation slowed to a 3-month low in February, with decreases in airfares and gasoline partially offsetting shelter increases. Despite the easing, the report does not capture upcoming tariff impacts. The inflationary pressure from tariffs and a trade war would weigh on the economy and complicate the Fed’s path to its 2% target. Meanwhile, while housing drove nearly half of February’s inflation increase and remains higher than the 2019 pre-pandemic average of 3.4%, it continues to show signs of cooling – the year-over-year change in the shelter index remained below 5% for a sixth straight month and posted its lowest annual gain since December 2021.
While the Fed’s interest rate cuts could help ease some pressure on the housing market, its ability to address rising housing costs is limited, as these increases are driven by a lack of affordable supply and increasing development costs. In fact, tight monetary policy hurts housing supply because it increases the cost of AD&C financing. This can be seen on the graph below, as shelter costs continue to rise at an elevated pace despite Fed policy tightening. Additional housing supply is the primary solution to tame housing inflation and with it, overall inflation. This emphasizes why the cost of construction, including the cost of building materials, matters not just for housing but also the inflation outlook and the path of future monetary policy.
Consequently, the election result has put inflation back in the spotlight and added additional upside and downside risks to the economic outlook. Proposed tax cuts and tariffs could increase inflationary pressures, suggesting a more gradual easing cycle with a slightly higher terminal federal funds rate. However, economic growth could also be higher with lower regulatory burdens. Given the housing market’s sensitivity to interest rates, a higher inflation path could extend the affordability crisis and constrain housing supply as builders continue to grapple with lingering supply chain challenges.
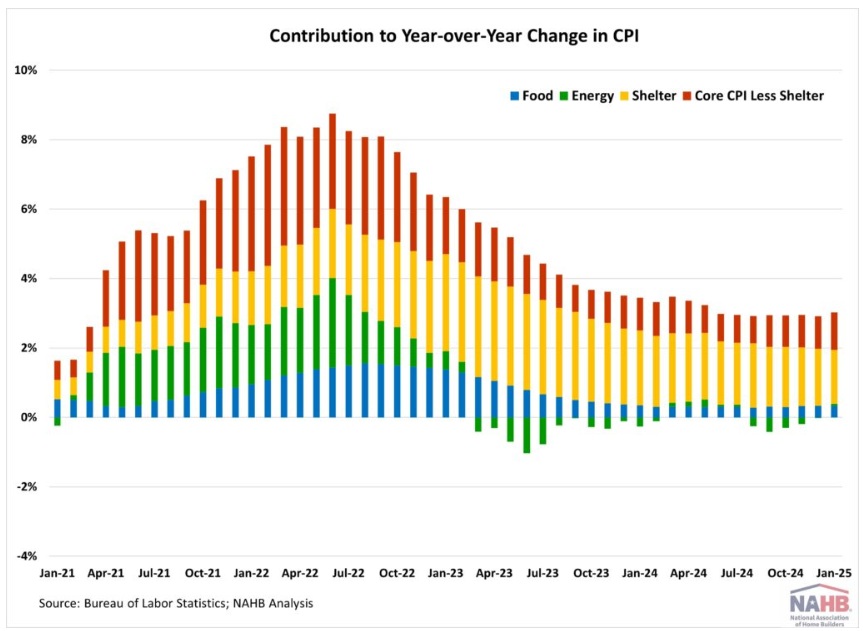
During the past twelve months, on a non-seasonally adjusted basis, the Consumer Price Index rose by 2.8% in February, according to the Bureau of Labor Statistics’ report. This followed a 3.0% year-over-year increase in January. Excluding the volatile food and energy components, the “core” CPI increased by 3.1% over the past twelve months, marking the first notable decline after hovering between 3.2% and 3.3% since June 2024. A large portion of the “core” CPI is the housing shelter index, which increased 4.2% over the year, the smallest year-over-year increase since December 2021. Meanwhile, the component index of food rose by 2.6%, and the energy component index fell by 0.2%.
On a monthly basis, the CPI rose by 0.2% in February (seasonally-adjusted), after a 0.5% increase in January. The “core” CPI increased by 0.2% in February.
The price index for a broad set of energy sources rose by 0.2% in February, with declines in gasoline (-1.0%) offset by increases in electricity (+1.0%), natural gas (+2.5%) and fuel oil (+0.8%). Meanwhile, the food index rose 0.2%, after a 0.4% increase in January. The index for food away from home increased by 0.4% and the index for food at home remained unchanged.
The index for shelter (+0.3%) was the largest contributor to the monthly increase in all items index, accounting for nearly half of the total increase. Other top contributors that rose in February include indexes for medical care (+0.3%), used cars and trucks (+0.9%), household furnishings and operations (+0.4%), as well as recreation (+0.3%). Meanwhile, the index for airline fares (-4.0%) and new vehicles (-0.1%) were among the few major indexes that decreased over the month.
The index for shelter makes up more than 40% of the “core” CPI, rose by 0.3% in February, following an increase of 0.4% in January. Both indexes for owners’ equivalent rent (OER) and rent of primary residence (RPR) increased by 0.3% over the month. Despite the moderation, shelter costs remained the largest contributors to headline inflation.
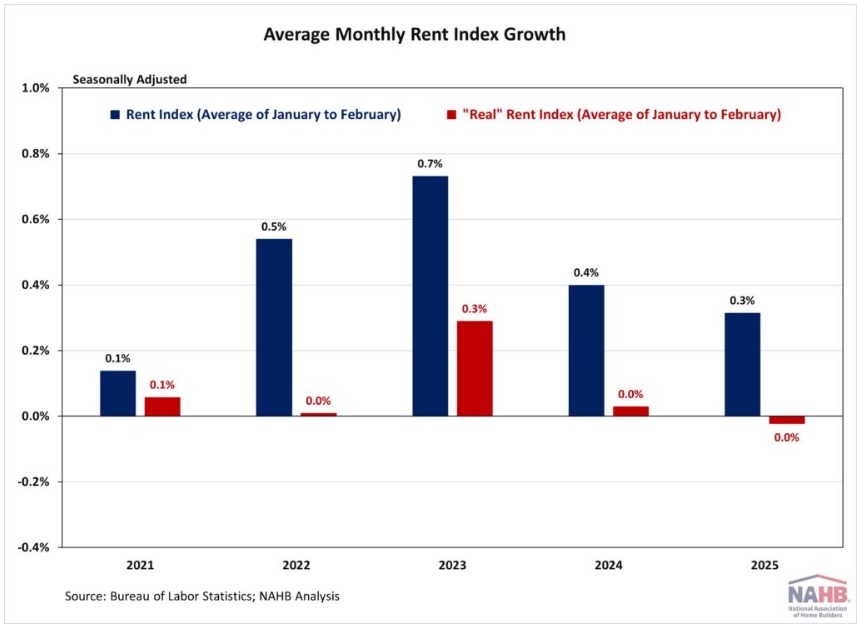
NAHB constructs a “real” rent index to indicate whether inflation in rents is faster or slower than core inflation. It provides insight into the supply and demand conditions for rental housing. When inflation in rents is rising faster than core inflation, the real rent index rises and vice versa. The real rent index is calculated by dividing the price index for rent by the core CPI (to exclude the volatile food and energy components).
In January, the Real Rent Index rose by 0.1%. Over the first two months of 2025, the monthly growth rate of the Real Rent Index averaged remained flat at 0.0%, unchanged from the same period in 2024.