TUCSON, Arizona (July 16, 2026) — An industrial investment property at 1791 W. Dairy Place in Tucson has sold for $1.9 million.
N & S LLC sold the property to Larry S. and Danielle Da Rosa of San Diego. The transaction closed June 29.
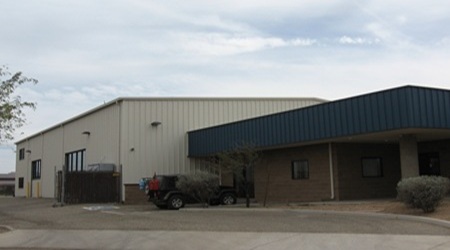
The approximately one-acre property includes 13,515 square feet in two buildings: an 11,035-square-foot warehouse and a 2,480-square-foot office building. The sale price equates to approximately $140.58 per square foot.
The warehouse and office property features four grade-level roll-up doors, 18-foot ceiling heights, bath and shower improvements, exterior yard access, and a yard and parking area. The property also includes an ISO 7 cleanroom and additional office, warehouse, manufacturing, and conference room space.
The property was marketed for $1.999 million and sold at a reported 12.99% capitalization rate. Existing tenants generate approximately $21,650 per month in rent, plus triple-net expenses.
Rob Lamb with Long Realty Co. represented both the seller and buyer in the transaction.
Built in 2000, the property is located within Shamrock Center near North La Cholla Boulevard and West River Road in Tucson’s central industrial submarket.
For more information, Rob Lamb can be contacted at 520.444.4411.
Source: RED Comp #12574
CBRE: Phoenix Industrial Vacancy Tightens as Leasing and Construction Accelerate
PHOENIX, ARIZONA (July 16, 2026) — Metro Phoenix industrial market continued to strengthen during the second quarter of 2026, as robust tenant demand pushed vacancy lower, supported strong absorption and encouraged developers to rebuild the construction pipeline.
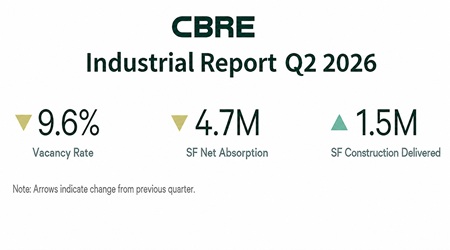
The market recorded 4.7 million square feet of net absorption during the quarter, while overall vacancy declined to 9.6%, according to CBRE’s Phoenix Industrial Figures report for Q2 2026. Approximately 1.5 million square feet of new industrial space was delivered, and the volume under construction increased to 18.4 million square feet. The average monthly triple-net asking lease rate rose to $1.09 per square foot.
Quarterly absorption was down 7.7% from the first quarter but remained 7.5% higher than during the same period last year. Vacancy fell 70 basis points from 10.3% in the first quarter and was 260 basis points below the 12.2% rate recorded one year earlier.
Direct vacancy decreased from 9.7% to 8.9%, while sublease vacancy remained unchanged at 0.7%. Approximately 3 million square feet of sublease space was available across the Phoenix industrial submarkets tracked by CBRE.
“Over the last three years, cumulative net absorption reached 47.7 million square feet, the highest it has ever been as Phoenix continues to grow into a Tier 1 market,” CBRE stated in the report.
During that same three-year period, developers delivered approximately 77.5 million square feet of new industrial space. Although the construction pipeline reached a high of 48.8 million square feet in 2023, development activity subsequently contracted as the market worked to absorb the wave of new supply.
That adjustment appears to be reversing.
The 18.4 million square feet under construction at the end of the second quarter represented a 31.2% increase from the previous quarter and a 59% increase from one year earlier. The pipeline had fallen to approximately 10.2 million square feet by the fourth quarter of 2025 before beginning to rebuild in 2026.
Construction activity was concentrated in the Southwest Valley, where approximately 7.6 million square feet was underway, according to CBRE’s submarket statistics. The Southeast Valley followed with approximately 5.6 million square feet under construction, while the Northwest Valley had nearly 2.6 million square feet underway.
Major projects contributing to the pipeline include three large logistics developments in the Southwest Valley, the LG Energy battery manufacturing facility in the Southeast Valley and the first phase of the Amkor testing facility in the Northwest Valley.
The Southwest Valley also remained the market’s strongest demand center, accounting for approximately 3.1 million square feet of second-quarter net absorption. The Southeast Valley recorded 1.1 million square feet, followed by the Northwest Valley with 440,000 square feet and the Northeast Valley with 143,000 square feet.
The Airport Area was the only submarket to post negative absorption, returning approximately 102,000 square feet during the quarter.
CBRE noted that tenants are demonstrating a growing preference for newer, higher-quality projects on the outskirts of the metro area, where rental incentives and more competitive lease rates are helping attract users from more centrally located properties.
Leasing activity totaled 10.6 million square feet during the quarter, down 9.4% from the first quarter but 44.6% higher than a year earlier. Combined first- and second-quarter leasing reached a record 22.3 million square feet for the first half of the year.
Several large transactions helped drive that performance. DHL signed a nearly 1.19-million-square-foot lease near Reems Road and Northern Parkway and an additional 403,000-square-foot lease on Glendale Avenue.
Fluidstack completed two Southwest Valley leases totaling approximately 1.15 million square feet. Other major transactions included a 387,000-square-foot DiversiTech lease, a 284,000-square-foot Lam Research lease and a 270,000-square-foot Komatsu America lease in the Southeast Valley.
Industrial rents also moved higher as vacancy tightened. The average asking rate of $1.09 per square foot represented a 2.8% quarterly increase and a 0.9% year-over-year increase.
The Northeast Valley commanded the market’s highest average asking rent at $1.76 per square foot, followed by the Airport Area at $1.19 and the Southeast Valley at $1.16. The Southwest Valley remained the most affordable major submarket at an average of 91 cents per square foot.
Vacancy varied considerably across the Valley. The Northeast Valley recorded the lowest rate at 6.7%, followed by the Airport Area at 7.5%, the Northwest Valley at 7.8% and the Southwest Valley at 8.9%. The Southeast Valley posted the highest vacancy at 13.8%.
Despite uneven conditions among individual submarkets and building sizes, the combination of falling vacancy, record first-half leasing and renewed construction activity indicates the Phoenix industrial market is steadily absorbing the substantial development completed during the past several years.
Pima County awards nearly $4 million through Outside Agency program
Interfaith Community Services has a food bank that was supported by the Pima County Board of Supervisors.
PIMA COUNTY (July 16, 2026) – The Pima County Board of Supervisors at its July 14 meeting approved $3,936,620 in funding for the Community & Workforce Development Outside Agency Program for the 2026-27 fiscal year.
The funding supports the second pillar of the Pima County Strategic Plan– improving quality of life for residents – by helping nonprofit organizations provide vital economic development, health, and social services to low-income, rural and economically underserved communities.
The Outside Agency Citizen Review Committee received a record 159 applications for programs from 96 community-based agencies, requesting more than $11.4 million in funding. The committee recommended funding for 127 programs.
“The new priorities opened the door to different nonprofits, and this year’s funding includes 58 programs receiving awards for the first time,” said Dan Sullivan, Pima County’s Community & Workforce Development director. “By listening to community needs and maintaining a transparent process, the County has strengthened the ability of a wider range of nonprofit partners to deliver essential services.”
As the first year of the new two-year funding cycle, the Board approved awards across six competitive priority service categories:
Basic Needs: $1,221,145
Community Well-being and Safety: $161,890
Education and Workforce Development: $545,670
Health and Wellness: $424,460
Prosperity Initiative: $165,285
Youth and Family Services: $276,470
The Prosperity Initiative awards support new programs such as financial education and local business support. In addition, Prosperity Initiative alignment was a scoring factor in all other competitive categories.
Another $660,142 is set aside for General Services, while $481,558 supports County departments managing Outside Agency Programs with other sources, including the Pima Association of Governments.
The largest beneficiary is the Community Food Bank of Southern Arizona, which will receive $390,258 for four programs, including $262,873 for emergency food assistance.
The Outside Agency Citizen Review Committee consists of six members appointed by each member of the Board of Supervisors and the County Administrator.
 PHOENIX, ARIZONA (July 16, 2026) — Metro Phoenix industrial market continued to strengthen during the second quarter of 2026, as robust tenant demand pushed vacancy lower, supported strong absorption and encouraged developers to rebuild the construction pipeline.