Phoenix Office CRE Market Update – Third Quarter 2026
 Phoenix Market Highlights
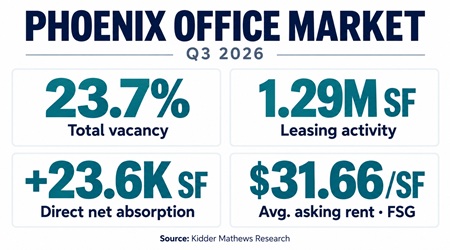
- Leasing activity declined year over year to 1.29 million square feet.
- Sales volume totaled 470,000 square feet.
- Total vacancy decreased 10 basis points year over year to 23.7%.
Market Drivers
The Phoenix office market recorded 23,600 square feet of positive direct net absorption in the third quarter. Central Corridor led submarkets with 105,600 square feet of positive absorption, while East Phoenix recorded the largest loss at negative 64,600 square feet. By building class, direct net absorption totaled positive 48,820 square feet for Class A and positive 14,036 square feet for Class C. Class B recorded negative absorption of 39,236 square feet.
Demand for sublease space remained strong. Class A sublease absorption totaled 40,300 square feet, accounting for nearly half of the segment’s total net absorption of 89,200 square feet.
Leasing activity totaled approximately 1.3 million square feet, down from the previous quarter. Average direct asking rents held at $31.66 per square foot on a full-service gross basis, up 2% year over year.
Total vacancy stood at 23.7%, down 10 basis points from both the previous quarter and a year earlier. Vacancy by building class remained relatively stable, at 28.3% for Class A, 18.5% for Class B and 11.1% for Class C. Class A properties continued to command the highest average direct asking rents at $34.50 per square foot, full-service gross.
Near-Term Outlook
The Phoenix office market continues to move toward stabilization. Office-using employment increased 1.3% year over year in July, marking its strongest annual growth since mid-2022. Meanwhile, developers are approaching office investment selectively, with greater emphasis on renovating and repositioning existing properties.
Limited new construction, combined with the potential removal or conversion of older, underperforming buildings, could gradually reduce office inventory. That shift may increase competition for well-located, updated properties offering modern amenities and flexible layouts.
Properties that respond to evolving tenant needs should remain better positioned to attract and retain occupants. Older commodity space, however, may continue to experience a slower recovery.
Source: Kidder Mathews Research Group. Data sources: CoStar, AZ Big Media, U.S. Bureau of Labor Statistics and Yardi Research.