Redfin: Selling at Record Speed Home Prices Jump 6.5% in April

Phoenix Median Sale Price up by 5.6% -Tucson Median Sale Prices up 3.6%
Redfin’s National Market Tracker follows housing trends in the country’s largest metropolitan divisions (those with population 500,000 or greater) served by Redfin agents. Analysis by Redfin is based on all residential home sales transacted on the multiple-listing service and supplemented by county recorder data where available.
Redfin is reporting home sales increased at a rate of 5.4% in April compared to a year earlier, and the median sale price rose 6.5% year-over-year to $275,700. April was the third month in a row that prices grew above 6%, a sign that demand is putting more upward pressure on prices. Growth in home prices had eased for much of last year, settling at a steady rate of around 5.5%.
Newly listed homes for sale climbed 10.7%, the third straight month of growth at around 10%, while inventory remained flat year over year.
Strong homebuyer demand is favoring sellers, with 21% of homes sold above asking price, an increase of 0.3% compared with last April and the first year-over-year increase in 19 months. Typically, this rate peaks in June, meaning we could see an even more competitive market this year than at the peak of 2013. On average, homes sold in 31 days, two days faster than this time last spring. More than a third of all new listings sold in less than two weeks.
Other April Highlights:
Prices:
- The Bay Area saw another explosion in year-over-year price growth, with San Francisco prices increasing 22.2% to $1.1 million, and San Jose up 21.6% to $900,000, the strongest gain for both metro areas in two years.
- Denver had a sixth-straight month of double-digit price growth, rising 16.7% to $315,000.
- Baltimore prices have fallen year over year for nine of the last 10 months. The metro area’s median sale price was $230,000 in April.
Sales:
- Tacoma, WA, saw the largest year-over-year increase in home sales at 24.9%, followed by Portland, OR, (21.4%) and Minneapolis (21.3%).
- Boston saw a big year-over-year drop in sales, with 9.5% fewer homes selling compared to last April. Since the beginning of 2014, year-over-year Boston sales have fallen every month but October. April’s decline was the largest during that period.
- Sales in San Francisco and San Jose fell dramatically. Only 659 homes in the San Jose market sold in April, a decline of 57.2% compared to a year earlier. San Francisco posted a 27.5% decline, with 1,073 homes sold.
Competition:
- The average home in Denver sold in just five days in April, breaking its own record of 7 days set in March.
- Seattle also saw its own fastest-ever market with the average home selling in just nine days. And 43.4% of homes sold above asking price, the second highest percentage ever recorded (the highest of 44.3% set in June of 2013).
Fresno, CA, and Denver saw the biggest jumps in the percentage of homes selling above asking price. In Fresno, 19.5% of homes sold above asking, up by 19.1 percentage points. In Denver, 51.2% of homes above asking price, up 18.4 points from last April.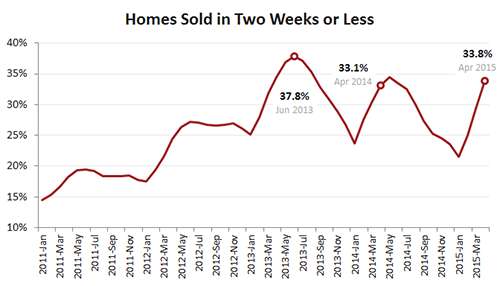 New Listings:
- Fresno, CA, had the largest increase in new listings over the previous year, with 30.8% more homes listed. Boston (25.6%), Riverside-San Bernardino (24%), Allentown, PA, (23.8%), and Richmond, VA, (20.3%) also had strong growth in new listings.
- San Francisco (-9.2%), San Jose (-1.1%), and Oakland, CA, (-0.1%) were the only Redfin markets with fewer new listings in April compared to the previous year.
- Fort Myers-Cape Coral, FL, had the biggest growth in median list prices, rising 18.4% to $225,000 in April.
Data for the April National Market Tracker can be downloaded as an Excel Spreadsheet.
Median Sale Price (other cities tracked by Redfin have been removed here)
| Metro | Median Sale Price | Month-over- Month |
Year-over- Year |
| Phoenix, AZ | $206,000 | 0.5% | 5.6% |
| Tucson, AZ | $171,000 | -2.3% | 3.6% |
| Overall Average |
$275,700 | 2.0% | 6.5% |
Median List Price
| Metro | Median List Price | Month-over- Month |
Year-over- Year |
| Phoenix, AZ | $239,900 | 2.1% | 9.1% |
| Tucson, AZ | $197,000 | -1.5% | 4.2% |
Homes Sold
| Metro | Homes Sold | Month-over- Month |
Year-over- Year |
| Phoenix, AZ | 8,114 | 6.5% | 9.9% |
| Tucson, AZ | 1,277 | 9.3% | 2.5% |
New Listings
| Metro | New Listings | Month-over- Month |
Year-over- Year |
| Phoenix, AZ | 9,736 | -2.5% | 0.3% |
| Tucson, AZ | 1,908 | -2.7% | 9.7% |
Inventory
| Metro | Inventory | Month-over- Month |
Year-over- Year |
| Phoenix, AZ | 32,350 | 2.1% | -9.8% |
| Tucson, AZ | 9,161 | 6.7% | 12.5% |