Phoenix Industrial Market Posts Impressive Third Quarter
 Sales Volume rose to $1.47 billion in Q3, with cap rates averaging just over 6%
Phoenix (November 4, 2025) – The Greater Phoenix industrial market posted an impressive third quarter, making it one of the nation’s leading cities for the quarter, according to a report released by Colliers. Net absorption nearly tripled from the second quarter, totaling 7.87 million square feet. Vacancy continued to decline, falling 110 basis points quarter-over-quarter to 9.8 percent.
A decline in new industrial space supply, combined with healthy leasing activity, drove the market to record two consecutive quarters of vacancy reduction—the first such improvement since the third quarter of 2022. Both direct and sublease vacancies fell during the third quarter, reflecting sustained leasing demand. Sublease availability ended the quarter at 7.65 million square feet, or 1.7 percent of total inventory. All submarket clusters, except the Airport Area, posted quarter-over-quarter vacancy declines. The Southwest Valley and Southeast Valley both improved year-over-year, ending at 8.0 and 12.1 percent, respectively. The Northwest Valley recorded the highest vacancy as 12.9 percent, accounting for 34.8 percent of the metro area’s 44.8 million square feet of vacant space. Vacancy within buildings under 150,000 square feet dropped to 6.8 percent.
Net absorption was up 193.7 percent from the second quarter and 300 percent higher than a year earlier. Year-to-date absorption has reached approximately 15 million square feet, representing a 28 percent increase from the same point in 2024. This 2025 net absorption leaves the market only 567,225 square feet shy of last year’s total. Northwest Valley led activity in third quarter with 5.7 million square feet absorbed, equating to 73 percent of all quarterly demand. Large-scale buildings dominated, with 11 new direct leases exceeding 200,000 square feet. Major deals included Walmart’s 1.28-million-square-foot commitment at Luke Field in Glendale and a Dollar Tree user purchase.
New deliveries continued to decline during the third quarter, with only 2.5 million square feet of new space completed. This was the lowest quarterly total for completions since the second quarter of 2021. Year-to-date construction completions total 13.4 million square feet. The Northwest submarket cluster continued to post the largest share of completions, representing 52.9 percent of new deliveries in the quarter and adding 1.3 million square feet. The slower pace of completions reflects the large volume of deliveries the market posted in recent years, combined with strong absorption and sustained tenant demand.
Additionally, economic uncertainty and tariff-related cost pressures from earlier in the year have caused developers to be more cautious. The largest project completed during the quarter was the Olive Logistics Center in Glendale, consisting of two buildings totaling 1,032,079 square feet, which were delivered 100 percent vacant. The Southwest submarket added 529,503 square feet of inventory, with the largest project of the area being Formation Park 10 in Goodyear. The level of industrial construction ticked up slightly from the prior quarter, with 11.4 million square feet currently underway.
Rental rates increased slightly, 0.15 percent year-over-year, ending at $1.13 per square foot, but showed a decline of 0.59 percent from the previous quarter. All three product types—Warehouse/Distribution, Manufacturing, and Office Service—posted small quarter-over-quarter decreases. Despite the recent dip, industrial rental rates have increased by 28.6 percent over the past three years and by 9.9 percent over the past two years. The most significant year-over-year increase was posted in the Northeast submarket, moving up 2.88 percent to $1.49 per square foot. The Southeast submarket continued to post the most significant year-over-year decrease in rental rates, falling 4.24 percent to $1.24 per square foot.
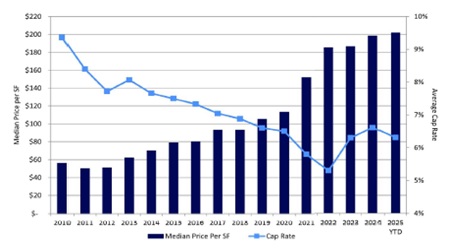
Institutional investors are dominating the investment activity of big box properties in the Phoenix industrial market. This highlights Phoenix’s role as a national logistics hub even as private buyers step up. Back in 2019, institutions controlled 57 percent of industrial transactions and, over the past five years, private buyers have steadily closed the gap. Sales volume rose to $1.47 billion during the third quarter, marking a significant 53.2 percent increase quarter-over-quarter and a 35.5 percent increase year-over-year. Year-to-date sales volume reached $3.22 billion, a 34.39 percent increase from the first three quarters of 2024. The average price per square foot in the third quarter decreased slightly to $202, representing a 0.8 percent decrease from the same period last year. After four straight quarters of the Southeast submarket cluster leading the sales volume, the Northwest cluster took the lead in the third quarter. Northwest reported a volume of $636.8 million, accounting for 43.46% of all sales in the third quarter. The successful transactions included four in Glendale, all of which ranked among the top five transactions by sale price. The largest sale was the Dollar Tree Distribution Center, a 1.25-million-square-foot building purchased for $147 million. All five top sales in the third quarter were Class A buildings, underscoring the continued demand for high-quality industrial assets in Phoenix.
The Phoenix industrial market remains well-positioned for continued strength. The region’s growing semiconductor ecosystem will play a central role in sustaining long-term demand. A key highlight was Amkor’s announcement of an additional $5 billion investment to expand its semiconductor packaging and testing operations. Steady in-migration, strong employment growth, and a diversified industrial base are expected to keep Phoenix among the nation’s most dynamic industrial markets heading into 2026.
For the full report click here.
 CHANDLER, Ariz. (July 7, 2025) – GO Industrial completed the sale of GO|AZ Ave, a 181,655-square-foot industrial building at 2377 S Arizona Ave. in Chandler, to Applied Materials.