Phoenix 4Q Retail Performance Breaks Records

Vacancy and Absorption Overall Phoenix

The retail market in the Phoenix metro area has improved every year for the past six years.  Slow and steady improvement each year has been recorded providing a bright future for retailers, building owners and investors looking at the Phoenix market.

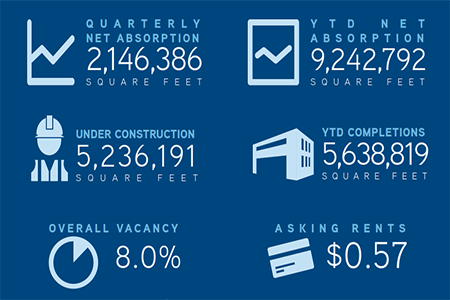
Since 2012 the vacancy rate in Phoenix has improved 300 bps, with the current vacancy at 8.8%.  Absorption is also strong with 2.25 million square feet leased in 2017.  These indicators, combined with healthy new construction deliveries of 1.7 million square feet make for a trifecta of positive indicators in commercial retail for Phoenix.

In looking ahead to 2018, we project continued steady absorption, new construction that is fueled by tenant demand, and a continued decrease in the vacancy rate.

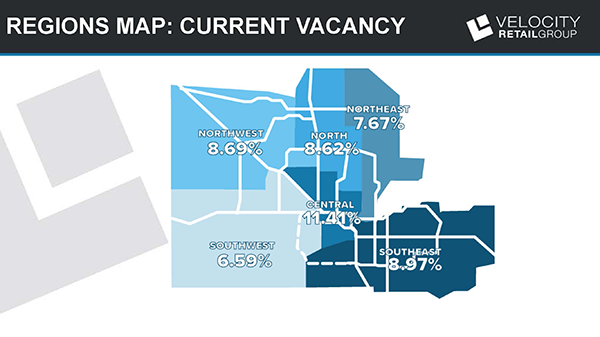
The Phoenix Regional Submarkets

Our research breaks the Metropolitan Phoenix area into six regional submarkets.

During 2017 the Southeast Valley recorded the greatest improvement and is an “All Star” performer in our books.

The Southeast Valley was one of the hardest hit submarkets during the recession. In 2012 the area had a 13.4% vacancy rate.  Fast forward to 2017, currently the area has a vacancy rate of 8.9%, which is a 450 bps improvement.  During 2017 the Southeast Valley also recorded the greatest amount of absorption, totaling nearly 1.3 million square feet.  This was over 57% of the absorption for the entire Phoenix metro market.  No other region came close to recording this amount of absorption.  The Southeast region also captured the greatest amount of new construction activity during 2017, with over 38% of the new space built being within this regions boundary’s.

Another Regional All Star is the Southwest Valley, with a current vacancy rate of 6.6% this is the submarket with the lowest recorded vacancy.  In 2012 the vacancy rate was 9.9%, which is a 330 bps improvement in this time period.  Absorption totaled just over 200,000 square feet, with new construction projects at 208,000 square feet.

Overall, each of the six submarkets improved in vacancy and absorption year over year. With continued strong retailer demand we expect continued progress on all fronts across the Valley.


Greater Phoenix Industrial Vacancy Drops to Lowest Level in 10 Years

Large Tenants Push 2017 Net Absorption to Decade High Level

Phoenix, Arizona – The Greater Phoenix industrial real estate market posted a strong fourth quarter finish to 2017, which was one of the city’s historically best years.  Net absorption was the strongest in a decade, absorbing robust construction completions and pushing the vacancy rate to a 10-year low.  To view the full industrial report from Colliers International in Greater Phoenix, click Here.

Net absorption of industrial space topped 2.1 million square feet in the fourth quarter, bringing the 2017 total to approximately 9.2 million square feet.  Large tenants drove up absorption during the past year, including Conair with its 800,000-square-foot space and UPS taking occupancy of more than 600,000 square feet in the Northwest Valley.  The Southwest Valley posted more than 1 million square feet of net absorption in the last three months of the year.

Industrial vacancy declined during each quarter of 2017, ending the year at just eight percent.  The vacancy dropped 30 basis points during fourth quarter and is 140 basis points below year-end 2016.  This marks the lowest industrial vacancy rate in Phoenix in more than 10 years. The Airport Area saw the most significant decline as the submarket’s recently completed spec projects experienced leasing.

Approximately 1.2 million square feet of new space was completed during the fourth quarter, bringing the total addition to the industrial inventory for 2017 to 5.6 million square feet. Construction has been steady in recent years, averaging 5.5 million square feet per year since 2013.  The market is expected to have 6.5 million square feet of new construction in 2018, the majority of which will be located in the West Valley.  The new Loop 303 freeway will be the focus of more than three million square feet of new building.

Asking rental rates dropped down a bit in fourth quarter 2017, but the year-end average of $0.57 per square foot is a 2.2 percent increase from year-end 2016.  Rental rates rose more steeply during 2015 and 2016.  The market experienced a leveling-off of big-box distribution rental rates during this past year, which impacted the overall rental rate trend. Rental rates are expected to increase approximately three percent during 2018.  New projects are being priced at the higher end of the rent spectrum and, if leased quickly, could push rates up in existing properties.

Sales of industrial buildings rose 13 percent during the final three months of 2017.  Sales velocity for 2017 was 16 percent higher than 2016 levels.  More buildings were sold in 2017 than in any year since 2007.  The median price for 2017 sales was $83 per square foot, up nearly 15 percent from 2016.  Cap rates compressed during 2017, particularly in the second half of the year.  The average cap rate during fourth quarter was in the mid-six percent range.  The average cap rate for 2017 was approximately seven percent, down 30 basis points from the 2016 average.

Greater Phoenix enjoyed great momentum in its industrial market during 2017.  Tenants took large blocks of space, development kept a healthy pace and vacancies tightened.  This momentum should continue in 2018 as businesses continue expansion.  Development of new projects is expected to increase since the city is now experiencing a 10-year low in vacancy.  The vacancy rate may show a few quarterly upticks during 2018 as new projects come online and need time for lease-up.  Strong tenant demand should compensate for that and produce an overall rate decline by year-end 2018.  Investment activity is expected to be healthy since property performance is strong and market sentiment is optimistic.  Interest rates are expected to rise, but increases thus far have not slowed the pace of investment activity in this market.


CBRE : U.S. Office Vacancy Ends 2017 at 13 Percent, Tucson declines 60 bps

CBRE is reporting vacant office space in the U.S. increased slightly by 10 basis points (bps) during the fourth quarter of 2017 (Q4 2017) to 13 percent, according to the latest analysis from CBRE. For the year, vacancy inched up 10 bps, marking the first year-over-year increase in vacancy since 2010.

The vacancy rate in suburban markets increased 10 bps, to 14.2 percent and downtown vacancy ticked up 10 bps to 10.7 percent. Vacancy continued to fall in a majority of U.S. office markets, and the national office vacancy rate remains near its post-recession low.

‘The fourth quarter’s slight office vacancy rise can be attributed to an increase of supply and a slight loosening in the tightness of the market as we have closed in on the previous cyclical low,’ said Spencer Levy, Americas’ head of research for CBRE.

The largest metro-area declines were recorded were recorded in Riverside (-80 bps), Salt Lake City (-70 bps) and Richmond (-60 bps). Tucson, Wilmington, Louisville, and Indianapolis, each declined by 60 bps or more. In the past four quarters, the vacancy tightening has been found in mid-sized markets located predominately across the Sun Belt, including Tucson, Las Vegas, Richmond, Albuquerque, Louisville, Orlando, Wilmington, Tampa, Phoenix, Kansas City, Riverside, Detroit and Jacksonville. The nation’s lowest vacancy rates list in Q4 2017 were led by tech markets: Seattle (7.6%), San Francisco (7.8%), Austin (8.2%), Raleigh (8.3%), New York (9.4%), and Boston (9.8%).

‘Despite the slight rise in vacancy, we see the new supply as healthy overall, as many markets were becoming space constrained, in particular for large block space,’ added Mr. Levy.

Click here for full story.