“West is Best” for 2017 Housing Growth Both Tucson – Phoenix in Top 10 List

top-10-imageThe realtor.com® economic team is forecasting that most of the nation’s hottest markets are going to keep blazing in 2017. And where will it be hottest? Head west! According to forecasts, the western U.S. will continue to lead the nation in prices and sales and Phoenix is right on top!

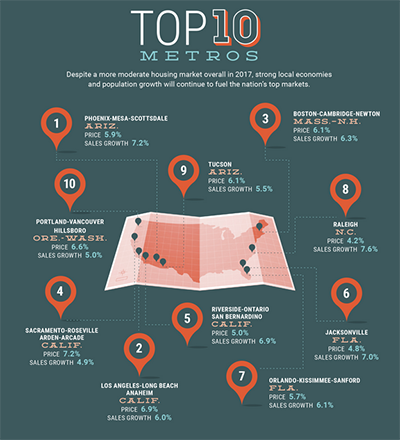
Despite a more moderate housing market overall in 2017, strong local economies and population growth will continue to fuel the nation’s hottest markets. The realtor.com® 2017 top 10 housing markets based on price and sales gains are: 1. Phoenix-Mesa-Scottsdale, Ariz.; 2. Los Angeles-Long Beach-Anaheim, Calif.; 3. Boston-Cambridge-Newton, Mass.-N.H.; 4. Sacramento–Roseville–Arden-Arcade, Calif.; 5. Riverside-San Bernardino-Ontario, Calif.; 6. Jacksonville, Fla.; 7. Orlando-Kissimmee-Sanford, Fla.; 8. Raleigh, N.C.; 9. Tucson, Ariz.; and 10. Portland-Vancouver-Hillsboro, Ore.-Wash.

top-10-metroHowever, compared with last year, price growth in eight of the top 10 markets is expected to slow down, with only Los Angeles and Tucson, AZ, showing bigger increases over last year.

“The top 10 markets all benefit from strong growth dynamics: population, jobs, and households,” says Jonathan Smoke, realtor.com’s chief economist, who analyzed the country’s 100 largest metropolitan markets for their growth potential. “They all have low unemployment that’s heading lower, which buoys consumer confidence.”

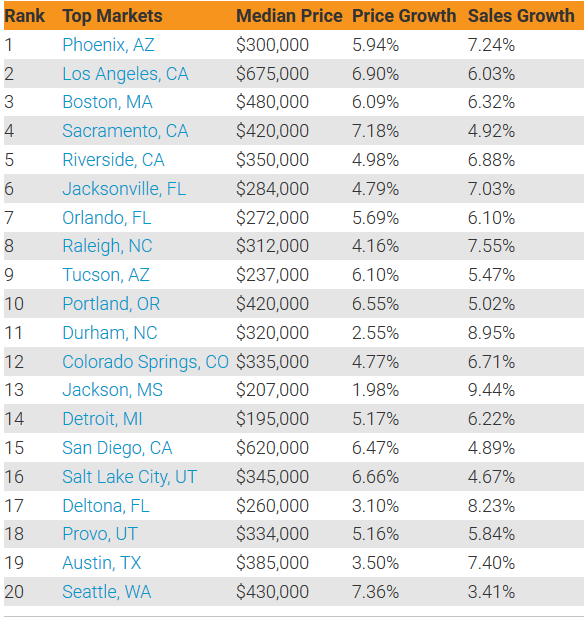
Western cities account for 11 of the top 25 metro markets on our list, including five in California. But whatever their location, all the top markets have in common relatively affordable rental prices, low unemployment, large populations of millennials and baby boomers, as well as a high number of listing views on realtor.com. The top 10 are forecast to see average price gains of 5.8% and sales growth of 6.3%, exceeding next year’s anticipated national growth of 3.9% and 1.9%, respectively.

To see full report click here.


Housing Market Midyear is on track for Best Year Since 2006 (and It Ain’t a Bubble)

Housing marketRealtor.com® is reporting seeing record traffic on its website at this midyear point. Real estate websites across the board are experiencing 15% year-over-year growth in unique users. The vast majority of the visitors to Realtor.com report that they intend to purchase a home.

Approaching the midpoint of 2015, it appears the residential real estate market is on track for its best year since 2006, the peak of the housing bubble. (This time, though, it’s no bubble.)

Job growth is powering the surge in demand for homes. More than 3 million jobs have been created in the past 12 months. And more than 1 million jobs have been created for 25- to 34-year-olds, the age range in which most Americans buy their first home.

With rising demand, homes are selling more quickly, too. In May the median age of inventory (homes on the market) nationwide was 66 days—that’s 8 days faster than for last year. The hottest markets are seeing inventory move 18 to 45 days faster.

A rapidly declining age of inventory signals that demand is growing more rapidly than supply. Indeed, we’ve had 32 months in a row of existing-home inventory at less than a six months’ supply. That’s why we’re also seeing above-normal price appreciation.

Year-over-year median home price appreciation reached 9% in April, which has helped existing homeowners see strong gains in equity.

That level of price appreciation would be problematic if it continued, but we don’t think it will. Median list prices, which often predict the direction of actual price changes, moderated in each of the past two months as the number of listings grew.

Meanwhile, rents are increasing at a similar or even stronger pace than home prices. Record numbers of renting households have driven down apartment vacancies, and low vacancies led to higher rents. As a result, it is cheaper to buy rather than rent in 80% of the counties in the U.S.

And now the clock is ticking as mortgage rates are on the rise. With strong employment data in April and May, the average 30-year fixed conforming mortgage rate broke through the 4% level, and in the past week moved above 4.10%.

Is that slowing down demand? No, just the opposite. Consumers can clearly see that affordability is going down for real, so those who are ready and able to buy are searching for homes, looking at listings, visiting open houses, applying for mortgages, and signing contracts.

In April, new-home sales were up 26% over last year. Pending home sales, which are new contracts on existing homes, were up 14%.

At this level of growth, total home sales in 2015 could come close to 6 million, which is a level comparable to 2007 (if not quite at the level of peak 2006). But 2007 was a year of decline for the housing market, whereas in 2015, we’re expecting more good things to come.


Strong Demand Continued in November as Home Prices and Inventory Post Annual Gains

NAR LOgo
Home Prices Gained in November

Realtor.com®, in its National Housing Trend Report for November 2013 indicates continued improvement from this time last year, in spite of the first signs of seasonal influences.

Data from realtor.com® reveal that November 2013 median list prices remained unusually strong for the season, showing a healthy 6.9% increase year-over-year while declining 0.7% month-over-month. National inventory appears to be stabilizing from dramatic drops in the beginning of the year, although the country is still experiencing significant supply shortages. Housing inventory increased 0.2% above year-ago levels – the first year-on-year increase in 2013 – while declining slightly from the previous month, believed to be a sign of seasonal influences.  Median age of inventory is down 10.6% compared with year-ago levels, showing significantly stronger activity compared to the same time last year.  Month-over-month, median age of inventory did show some seasonal change with an increase of 7.5%.

“The housing market in November continues to demonstrate encouraging signs of sustainability for the escalating gains this year in home prices,” said Errol Samuelson, president of realtor.com®. “With demand in a much stronger position compared to last year, we anticipate these gains to remain steady into 2014, but with increases expected at a more moderate pace than we have seen in 2013.”

The National Association of Realtors® (NAR) also recently predicted a flattening trend for 2014, noting that low housing inventory is holding back sales while pushing home prices higher in much of the country. NAR recently reported that existing-home sales declined for the third consecutive month in November.

Key Market Indicators for November 2013

November 2013 Year-over-Year
Percentage Change
Month-over-Month
Percentage Change
Number of Listings 1,846,155 0.2 percent -3.1 percent
Median Age of Inventory 101 days -10.6 percent 7.5 percent
Median List Price $197,700 6.9 percent -0.7 percent

National Perspective:

  • Inventories in November are just slightly higher (0.2%) than they were one year ago – a dramatic turnaround compared to the substantial year-over-year declines noted at the beginning of this year.
  • Median age of inventory is still down 10.6% year-over-year in spite of its seasonal monthly rise from 94 to 101 days. This suggests that properties continue to turn over relatively quickly regardless of the winter season, and despite increasing home prices and stabilizing inventory.
  • Median list prices are 6.9% higher than where they were one year ago. On a month-over-month basis, prices fell slightly in November but have remained resilient against the usual seasonal patterns and stabilizing inventory.

Local Market Highlights:

  • List prices still on the rise. The majority of housing markets are registering positive signs, with 111 of the 146 markets covered by realtor.com® showing year-over-year increases in their median list price of 1% or more, and only 10 markets registering declines of 1% or more.  California and Nevada markets continue to lead the country in terms of year-over-year-list price increases, followed by Arizona, Florida, and other areas that were once the epicenters of the housing crisis.  The Detroit metro market also has shown solid gains.
  • Inventory shortages have moderately eased. In many of these housing markets, rising list prices were primarily driven by a shortage in for-sale inventories. While still significant, these shortages are abating as sellers have attempted to take advantage this year of improving housing conditions. While inventories continue to be down on a year-over-year basis in the majority (86) of housing markets, the shortfalls are gradually declining.

The 10 Metropolitan Statistical Areas (MSAs) with the largest year-over-year declines in their for-sale inventories in November 2013 are listed below. While California housing markets dominated the list earlier in the year, this is no longer the case. With a few exceptions, California markets have largely been replaced by a few housing markets in Florida, as well as other markets that have recently drawn wide attention such as Boulder, Colo. and Detroit.

Inventory Reductions

10 Metropolitan Statistical Areas (MSAs) with the Greatest Year over Year Inventory Reductions

November 2013 vs. November 2012
MSA Nov. 2013
Total Listings
YoY
change
Santa Barbara-Santa Maria-Lompoc, CA 1,090 -21.2%
Naples, FL 5,682 -16.8%
Boulder-Longmont, CO 1,936 -16.0%
Honolulu, HI 2,842 -15.2%
West Palm Beach-Boca Raton, FL 15,824 -15.1%
Middlesex-Somerset-Hunterdon, NJ 6,516 -14.9%
Orange County, CA 8,464 -14.8%
Detroit, MI 16,070 -13.7%
St. Louis, MO-IL(MO) 12,034 -13.3%
Fort Worth-Arlington, TX 7,948 -12.5%
  • Age of inventory data tracks with recent hot and cold markets. Those markets with the shortest average days on market are similar to those of recent months – such as Oakland, Calif., San Jose, Calif., Phoenix, Detroit, and Honolulu. This demonstrates a continued steady rate of speed in those markets that have recently seen rapid movement.  The areas with the longest days on market – Santa Fe, N.M. (144), Wilmington, N.C. (137), Philadelphia (131) and Reading, PA (123) – highlight the continued weakness in some resort markets and older, industrialized communities.

Realtor.com® regularly tracks real estate data and develops monthly reports featuring the number of listings, median age of inventory and median list price across the U.S. and in specific markets, as well as provides year-over-year and month-over-month changes. These reports are the only ones pulled directly from the realtor.com® database, where 90 percent of listings are updated every 15 minutes from more than 800 MLSs. We regularly review and update historical data to provide the most accurate and comprehensive market information available. For more information on Move, please visit www.move.com or one of its many online real estate properties including realtor.com®.