

 TUCSON, AZ (May 31, 2024) -- Currently, the overall median rent in the city stands at $1,093, roughly the same as last month, according to Apartment List June 2024 Report. Prices remain down 0.5% year-over-year. Read on to learn more about what’s been happening in the Tucson rental market and how it compares to trends throughout the nation as a whole.
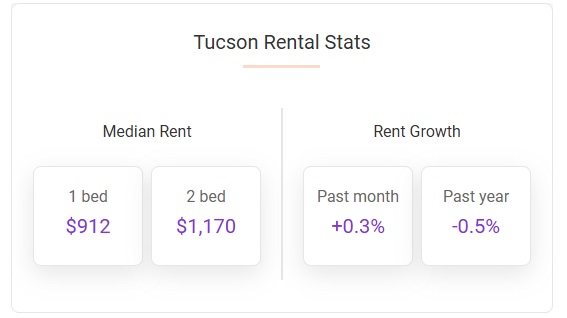
Tucson rents are flat month-over-month and down 0.5% year-over-year
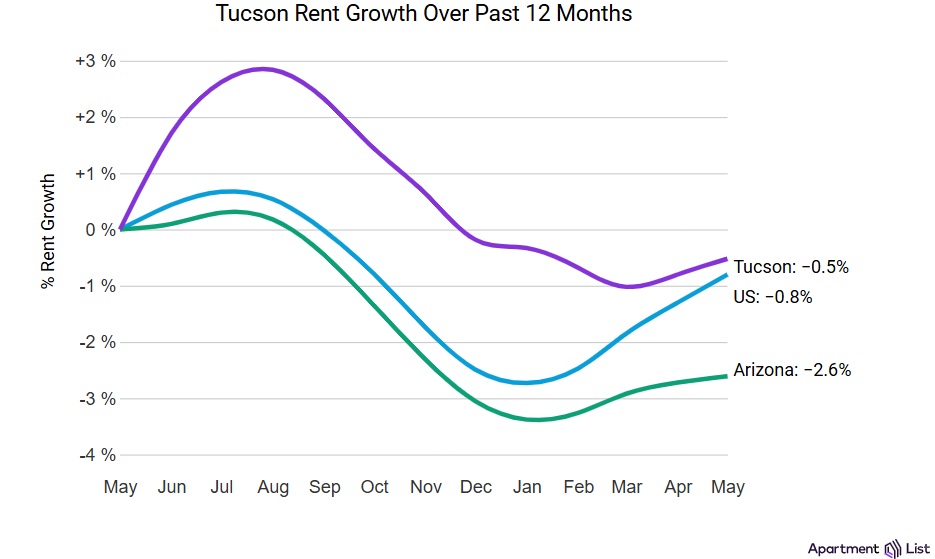
The median rent in Tucson rose by 0.3% for May, and has now decreased by a total of 0.5% over the past 12 months. Tucson’s rent growth over the past year has has outpaced the state average (-2.6%) and is similar to the national average (-0.8%).
Tucson rent growth in 2024 pacing below last year
Five months into the year, rents in Tucson have fallen 0.2%. This is a slower rate of growth compared to what the city was experiencing at this point last year: from January to May 2023 rents had increased 1.7%.
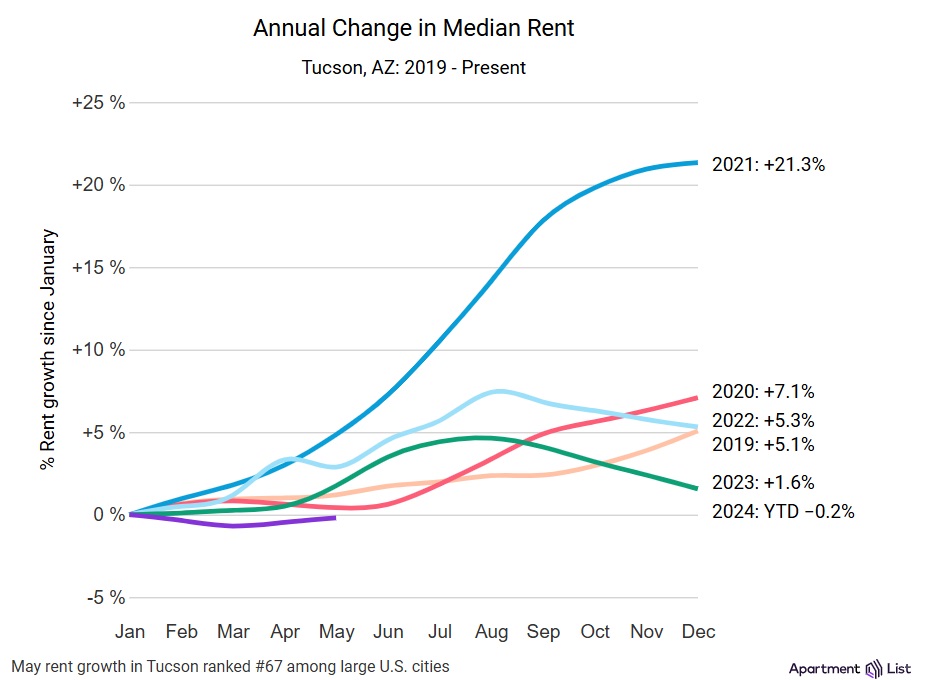
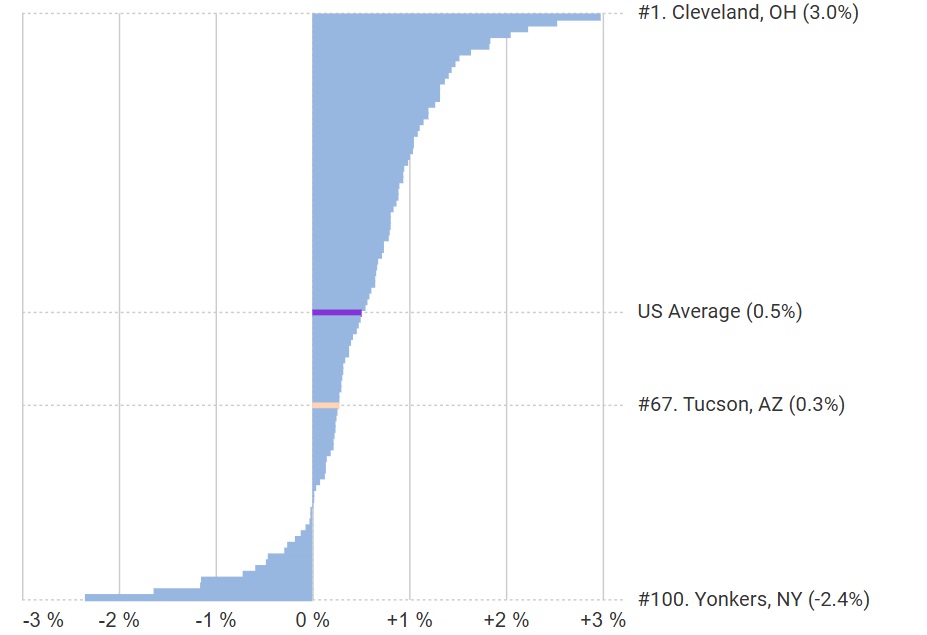
Tucson rents went up 0.3% in the past month, compared to the national rate of 0.5%. Among the nation's 100 largest cities, this ranks #67. Similar monthly rent growth took place in Austin, TX (0.3%) and Spring Valley, NV (0.3%).
Month-over-Month Rent Growth Among 100 Largest Cities In the U.S.
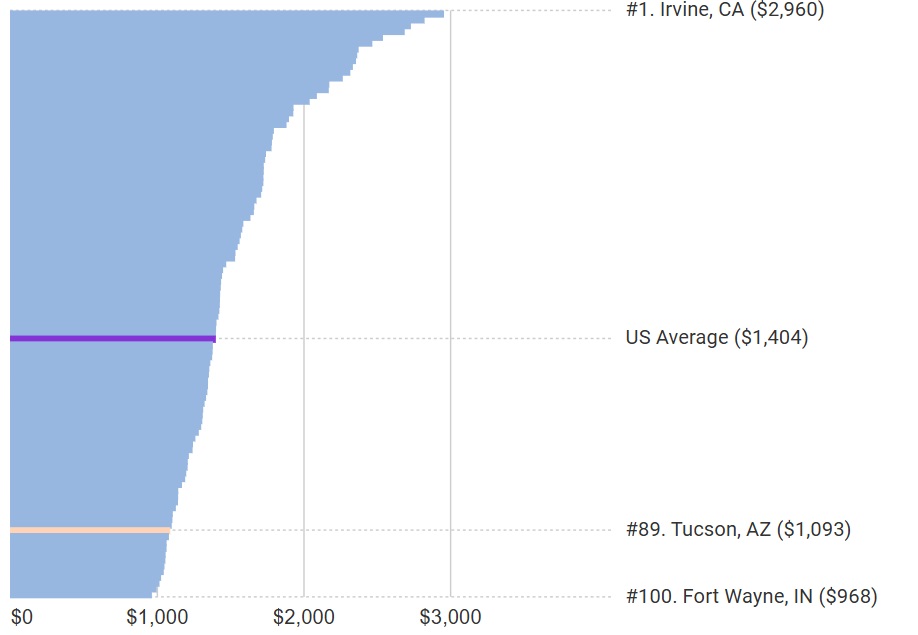
Tucson is the #89 most expensive large city in the U.S., with a median rent of $1,093.
Citywide, the median rent currently stands at $912 for a 1-bedroom apartment and $1,170 for a 2-bedroom. Across all bedroom sizes (ie, the entire rental market), the median rent is $1,093. That ranks #89 in the nation, among the country's 100 largest cities.
For comparison, the median rent across the nation is $1,233 for a one-bedroom, $1,389 for a two-bedroom, and $1,404 overall. The median rent in Tucson is 22.2% lower than the national average and is similar to the prices you would find in Lincoln, NE ($1,103) and Memphis, TN ($1,084).
Median Overall Rent Among 100 Largest Cities In the U.S.
METHODOLOGY
Apartment List is committed to the accuracy and transparency of our rent estimates. We begin with reliable median rent statistics from the Census Bureau, then extrapolate them forward to the current month using a growth rate calculated from our listing data. In doing so, we use a same-unit analysis similar to Case-Shiller’s approach, capturing apartment transactions over time to provide an accurate picture of rent growth in cities across the country. Our approach corrects for the sample bias inherent in other private sources, producing results that are much closer to statistics published by the Census Bureau and HUD. For more details, please see the Apartment List Rent Estimate Methodology.
Data Access
Apartment List publishes monthly rent reports and underlying data for hundreds of cities across the nation, as well as data aggregated for counties, metros, and states. These data are intended to be a source of reliable information that helps renters and policymakers make sound decisions. Insights from our data are covered regularly by journalists across the country. To access the data yourself, please visit our Data Downloads Page.