


PHOENIX, AZ (July 20, 2026) -- Keller Williams reports Phoenix’s commercial real estate market entered the second half of 2026 on firmer footing, with vacancy improving across the industrial, multifamily, office and retail sectors.
A mid-year analysis by Solex Commercial Real Estate, based primarily on CoStar market reports from May 2025 and June 2026, found that demand is beginning to catch up with the region’s recent wave of new construction. Industrial absorption strengthened as deliveries slowed, multifamily demand reached record levels, office vacancy declined amid renewed leasing and building demolitions, and retail remained the Valley’s tightest-performing property sector.
The following report examines the market’s year-over-year performance, the opportunities emerging for investors and property owners, and the challenges that remain as Greater Phoenix moves into the second half of the year.
Market Snapshot
This analysis compares Phoenix CoStar market data from May 2025 against the just-released June 2026 reports — a true year-over-year comparison rather than estimates. The headline finding across all four asset classes: vacancy improved, year-over-year, in every single sector. Phoenix has turned a corner.
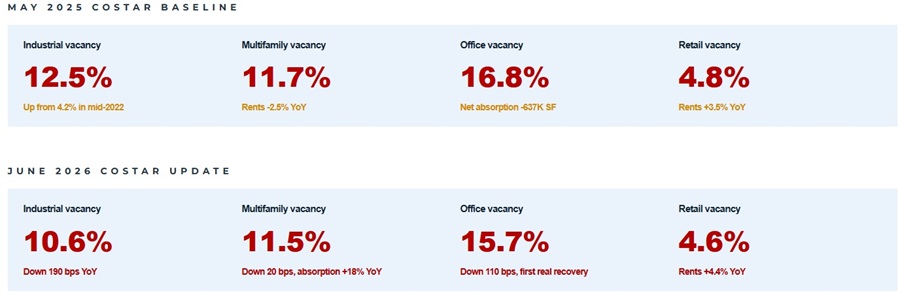
Vacancy & Rent Growth: May 2025 vs June 2026
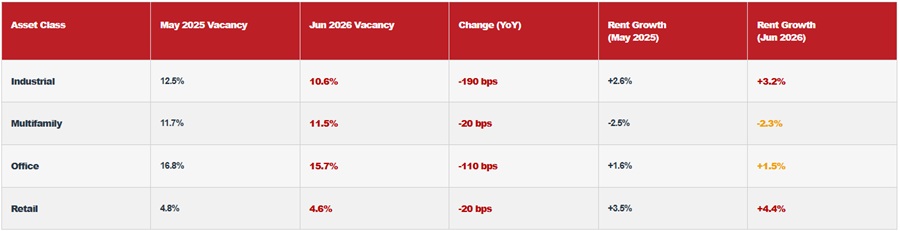
Asset-by-Asset Deep Dive
Industrial: Stabilization Confirmed, Institutional Capital Arriving
The May 2025 CoStar report described a market overwhelmed by supply — 31.4M SF delivered against 14.5M SF absorbed, vacancy at 12.5% and climbing. The June 2026 data confirms the turn: deliveries fell to 14.8M SF (down 53% year-over-year) while net absorption accelerated to 22.7M SF — the third most in the nation a year ago, now an even stronger pace. Vacancy compressed from 12.5% to 10.6%, a 190 basis point improvement.
CoStar’s own language shift is telling. The May 2025 report warned vacancy ‘could persist’ higher into 2026. The June 2026 report states plainly: ‘the supply-driven increase in vacancy that had hampered property performance since early 2023 has finally flattened out, as easing completions converged with steady tenant demand.’
The institutional capital story
Sales volume reached $5.2 billion in the 12 months ending Q1 2026, up roughly 13% year-over-year and accelerating — volume grew 3% quarter-over-quarter to start 2026. CoStar describes Phoenix as ‘a structurally different industrial investment market than it was before the pandemic,’ with private equity, investment managers, and major institutional buyers now active. Before the pandemic, the Valley recorded just two single-asset transactions of $100 million or more; since then there have been nine.
SENTRE’s October 2025 acquisition of 7000 West Buckeye Road for $57.75 million ($202/SF) at a 5.9% cap rate illustrates current pricing for stabilized, credit-leased product — a 2010-built cold storage facility fully leased to Cafe Valley through 2039. Walmart and Dollar Tree each paid $140+ million for newly-built 1.3 million SF owner-user distribution centers in the West Valley, the largest single-building deals of 2025.
Small-bay value-add is the new institutional target
BKM Capital Partners’ March 2026 recapitalization of Northwest Business Park is the template: $43 million ($185/SF) for an 11-building, 1980s-vintage small-bay flex park near I-17 and Dunlap, 94% occupied at sale, with a planned $2.6 million capital program to reduce office buildout and reposition for mark-to-market rent growth. The asset last traded in 2021 at $125/SF — a 48% gain over five years even through the supply glut.
Cap rates for newly-built, fully-leased large-bay logistics have moved up roughly 200+ basis points since the 2022 bottom, now pricing mid-to-high 5% for in-place market rents. Small and mid-bay infill product, insulated from the big-box supply wave, commands investor attention for its NOI growth potential through lease-up and rent mark-to-market.
What remains a headwind
- 21.5M SF still under construction — about half built on spec — will keep vacancy elevated near Great Recession-era highs through the back half of 2026.
- Large-format logistics (100K+ SF) vacancy remains above 16%, with another 7.5M SF of unleased big-box space underway.
- Sublet availability has ticked up, providing tenants more negotiating leverage in the bomber-box segment.
- A potential slowdown in trade flows and supply-chain build-out presents a downside risk to demand, though Phoenix’s position relative to Southern California ports and Mexico remains a structural advantage.
Multifamily: Demand Has Caught Supply
This is the most significant shift in the entire dataset. May 2025 showed 24,449 units delivered against 18,242 absorbed — a persistent gap driving vacancy to a 15-year high of 11.7% with rents down 2.5%. The June 2026 report shows the Valley recorded its highest quarterly net absorption on record in Q1 2026, bringing trailing 12-month absorption to 21,491 units — the strongest 12-month total on record (CoStar peak marker) — against just 20,429 delivered units. For the first time since early 2021, quarterly absorption outpaced quarterly deliveries.
Vacancy improved from 12.3% a year ago to 11.5% today. CoStar ranks Phoenix as a top-five demand market nationally, both in absolute units absorbed and as a percentage of inventory. Rent growth, while still negative at -2.3%, is a meaningful improvement from -2.5% and reflects a strong first quarter offset by softer second-half 2025 comps rather than ongoing deterioration.
Construction pipeline has been cut in half
Units under construction fell to 16,122 — down roughly 30% year-over-year and down 50% from the peak two years ago. That still represents 3.7% of existing inventory, keeping Phoenix among the nation’s most actively built apartment markets, but the trajectory is unmistakably toward balance. CoStar’s forecast calls for annual deliveries returning near pre-pandemic levels by 2027.
Buyers are coming back, and the buyer mix is shifting
Sales volume reached $4.7 billion in the 12 months ending Q1 2026, up 24% year-over-year and now more than 35% above the post-pandemic low. Critically, the composition of buyers is changing: the share of total sales volume for post-2020 vintage assets fell from roughly 50% to under 30% in early 2026, meaning value-add and opportunistic buyers are re-entering for older product.
Rise48, one of Phoenix’s most active value-add syndicators from 2020-2022, returned to the market in October 2025 after sitting out since early 2023 — acquiring Emparrado Apartments for $24.25 million ($157,500/unit), a 1980s-vintage Mesa community at 94% occupancy. Rise48 followed with a second Mesa acquisition in March 2026 at a 5.5% cap rate. 1980s/1990s product is trading in the $150,000 to $225,000 per unit range, up modestly over the past year but still 30-35% below 2022 peaks — a meaningful entry point for sellers who held through the downturn and are now seeing renewed buyer interest.
Institutional buyers remain active for newer product: Golden Horizon Enterprises paid $69 million ($355,700/unit) for Bella Grace, a 2015-built Chandler build-to-rent community, in November 2025 at a 5.1% cap rate — the asset last traded in 2018 for $232,000/unit, a 53% gain over seven years even accounting for the broader market correction.
Submarket performance remains sharply bifurcated
- East Valley (Chandler, Gilbert) and Scottsdale: stabilized vacancy at or below 7% — the strongest performing submarkets in the Valley.
- Valley-wide stabilized vacancy: high-8% range as of Q1 2026, still elevated but improving.
- West Valley and Southeast Valley: stabilized vacancy above 10% — continued oversupply risk through 2026.
- Downtown Phoenix, Tempe, and the Southwest Valley: highest concentration of remaining construction, slowest path to stabilization.
Office: The Real Surprise in This Data Set
Office was the asset class with the least encouraging May 2025 narrative — 16.8% vacancy, -637K SF of net absorption, and a sublease glut making Phoenix the fourth most heavily impacted sublease market in the country. The June 2026 data shows genuine, durable recovery, not just stabilization. Vacancy has fallen from a peak of 17.1% in 2024 to 15.7% today — a full percentage point of improvement — and net absorption has flipped solidly positive at +754K SF over the trailing 12 months.
Why office is actually recovering: demolitions, not just demand
The most important structural change is supply-side, not demand-side. Just 1.9 million SF of gross new office space delivered over the past three years combined — more than 20% below the 2015-2019 average — because equity and debt partners have shown almost no willingness to fund new speculative office. Simultaneously, demolition activity has accelerated: the Valley recorded a 1.5 million SF reduction in existing inventory over the past 12 months as obsolete, high-vacancy buildings are razed for redevelopment. Net supply growth is now negative.
Leasing volume tells the rest of the story: new office leasing reached approximately 10 million SF in the 12 months ending Q1 2026, within 5% of pre-pandemic levels. Banner Health’s January 2026 relocation — downsizing from 304,000 SF at Phoenix Plaza to 67,000 SF at Bond in the Camelback Corridor — exemplifies the broader trend of smaller, higher-quality footprints replacing larger, lower-quality ones.
The premium bifurcation is now the central story
Direct availability for non-medical, multi-tenant offices of 10,000+ SF stands at 21% Valley-wide, but just 13% for 5-Star product in the top three submarkets. Owner-users and redevelopers are aggressively absorbing distressed office: Lam Research purchased a 147,700 SF building near TSMC that had sat vacant since USAA departed during the pandemic. Avnet, U-Haul, Kellwood, and Discount Tire have made similar moves.
On the sales side, Wentworth Property Company’s February 2026 purchase of a pair of Class A buildings near TSMC for $26.75 million ($112/SF) at under 15% occupancy illustrates the magnitude of the repricing — the asset traded in 2013 for $229/SF when fully leased to Cigna, a 51% decline in value. That kind of basis reset is exactly what is now attracting private capital and owner-users back to the table. Office-to-industrial conversion has become a recognized strategy: Ryan Companies, ViaWest, Lincoln Property Company, and Meritex have all purchased high-vacancy office in the $75-85/SF range specifically to redevelop into infill industrial.
Sales volume reached $2.3 billion in the 12 months ending Q1 2026, up 12% year-over-year. Institutional capital remains a net seller of non-medical office, but private investors and owner-users have driven a genuine rebound in transaction activity.
Retail: Still the Tightest Sector in the Valley
Retail remains the standout performer, and the June 2026 data shows it strengthening further rather than merely holding steady. Vacancy improved modestly from 4.8% to 4.6%, while asking rent growth accelerated from 3.5% to 4.4% year-over-year — keeping Phoenix among the top five major U.S. markets for retail rent growth.
The availability rate (which includes space marketed but not yet vacant) has crept up to 4.9% from 4.2% in late 2023, driven by national brand bankruptcies and thin-margin small-business closures. CoStar is explicit that this remains well below the 8% range seen entering the pandemic and the prior cycle’s low of 5.8% in 2006 — this is a tightening market with a temporary blip in availability, not a deteriorating one.
Net absorption rebounding as off-price and experiential tenants backfill
The Valley recorded 2.5 million SF of net absorption over the trailing 12 months, a recovery from the negative absorption seen in 2024 as off-price retailers, dollar stores, and experiential tenants backfilled big-box vacancies left by 2024’s wave of closures.
Construction remains structurally limited
Just 3.0 million SF delivered over the past 12 months — still a fraction of the 10 million SF annual pace seen in the mid-2000s peak. The pipeline has grown modestly to 2.7 million SF, but supply-side pressure remains contained. New development continues to concentrate in high-growth suburbs: Vestar’s Verrado Marketplace in Buckeye ($275 million, 500,000 SF, anchored by Target, Safeway, and Harkins, 70% preleased) and Sun Belt Investment Holdings’ Costco-anchored Buckeye Commons (427,400 SF) both illustrate where the next wave of retail demand is concentrating.
Sales activity and cap rates
Retail sales volume reached $2.3 billion in the 12 months ending Q1 2026, up roughly 15% year-over-year from the $2.0 billion recorded in the May 2025 report. Cap rates across center types compressed modestly from their 2025 highs, with mall and power center product still pricing wider (7.0%+) than neighborhood and general retail assets, which continue to see investor demand push cap rates toward the high-5% to 6% range for well-located, leased product.
Read the full report here: https://www.solexcre.com/phoenix-commercial-real-estate-2026-mid-year-review/