

Five states hold one-third of the nation’s investor-owned single-family homes, and small investors continue to control more than 90% of the market.
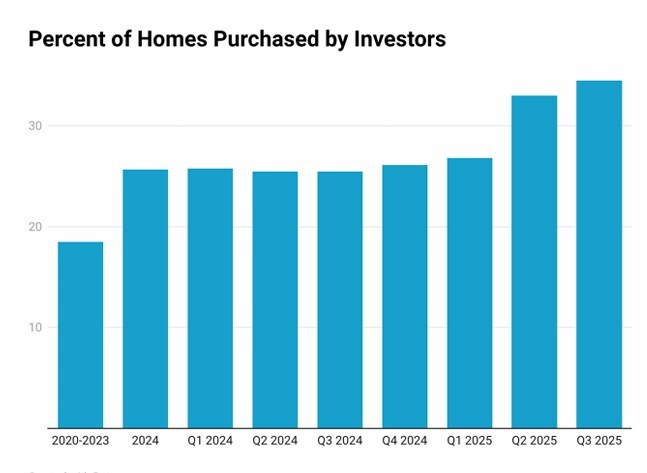
PHOENIX, (Jan. 15, 2026) — Real estate investors bought more than 34% of all single-family homes sold in Q3 2025, the highest share in five years, according to BatchData’s Q3 2025 Investor Pulse™ Report. That’s up from 33% in Q2 2025 and nearly eight percentage points higher than Q3 2024 (25.5%). In total, investors now own about 18% of the nation’s roughly 86 million single-family homes.
Prepared with CJ Patrick Company, the report tracks ownership patterns and transaction trends to inform real estate professionals and policymakers.
BatchData Co-Founder and President Ivo Draginov said the headline increase masks a key shift: investor market share climbed even as the number of homes investors purchased fell by about 23,000 year over year—suggesting traditional owner-occupants pulled back more than investors surged.
Small investors dominate as institutional portfolios shrink
Small-scale investors remain the backbone of the market. Owners of one to five properties account for nearly 92% of investor-owned single-family homes, with owners of six to 10 properties accounting for another 4%. At the other end of the spectrum, institutional owners with 1,000+ homes make up only about 2% of investor ownership. Q3 2025 was the seventh straight quarter in which these large investors sold more homes than they bought (5,798 sold vs. 4,663 acquired).
Where investor ownership is concentrated
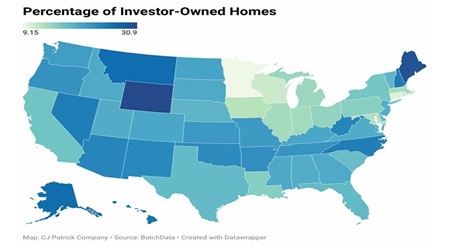
Investor-owned inventory is heavily clustered in five states—Texas, California, Florida, North Carolina, and Georgia—which together represent about one-third of all investor-owned single-family homes. Texas leads with roughly 1.4 million homes, followed by California (1.2 million) and Florida (1.0 million). Several of these states also exceed the national investor-ownership average, including North Carolina (25%), Georgia (19%), and Texas (18.2%).
Tourism-driven markets also stand out for elevated investor presence, led by Wyoming (30.9%), Maine (29.76%), and Montana (26.78%).
Metro takeaways
Across the 100 largest U.S. metro areas, investors own at least 18% of single-family homes in 48 markets. The Southeast continues to draw the most attention, claiming six of the top 10 metros by investor concentration. Asheville, NC, ranks highest at 30%, followed by Las Vegas (26%) and Memphis (26%). Institutional ownership is most pronounced in Jacksonville (2.67%) and Atlanta (2.63%).
Go to Batch Data Investor Pulse - Q3 2025 for more information.