 By Thomas Brophy, Director of Research, ABI Multifamily
Highlights forTucson MSA Multifamily 2Q 2018
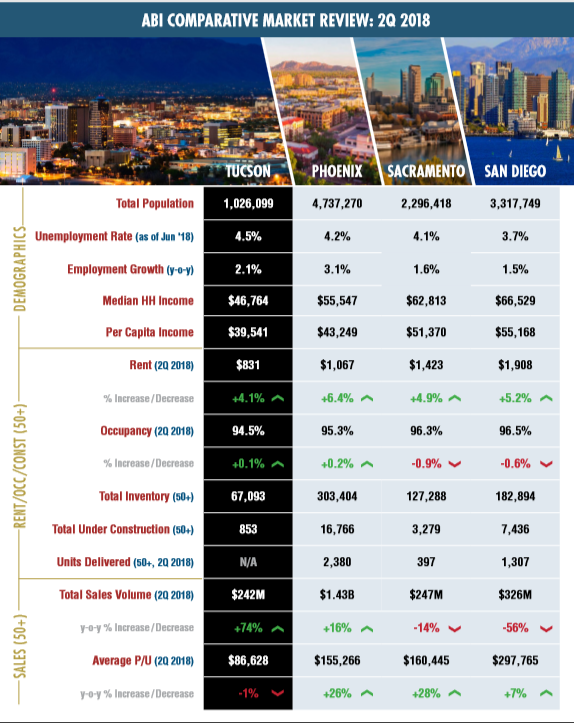
- Average rent continues to increase for the Tucson MSA rising 4.1% to a market high of $831 (which is $236 below Phoenix's $1,067/average rent).
- Occupancy Rate for the Tucson MSA remained at historic highs, actually increasing 10 bps (basis points) to 94.5%.
- Investment / Institutional Grade (IG) Properties (50+ units) saw continued interest rising 74% to $242M total sales volume led by new Tucson market entrant, Texas-based ComCapp (Commercial Capital Partners) who purchased 887 units across three properties.
The lateral line, in aquatic vertebrates such as sharks, is a system of sense organs which is used to detect movement, vibration, and pressure gradients in the surrounding water. As Discovery Channel’s ‘Shark Week’ detailed, sharks use changes in their environment, specifically sensing electro-magnetic waves/pulses via their lateral lines, to better position themselves to strike at prey. In more laymen terms, the lateral line enables the shark to detect its prey without seeing it. In today’s data-rich, information light, central banker skewed-market environment sometimes the only thing investors can truly count on is gut instinct and inspection of the market’s tea leaves. By all accounts the economy is firing on all cylinders with GDP at 4.1%, inflation just a tick over 2%, National unemployment at 4% and interest rates still hovering near historic lows.
As Elliott D. Pollack opined in his July 31st Monday Morning Quarterback newsletter, “most economists expect GDP this year to come in at or above 3.0%. And while how sustainable this is over the long run is open to debate (there are good demographic reasons to doubt that it is), the economy is doing just fine, thank you. Enjoy the party.”
TUCSON MARKET METRICS: By the Numbers
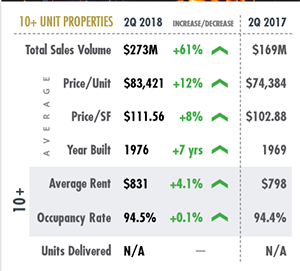 The MSA’s total sales volume (10+ unit properties) increased 61%, y-o-y, to $273 million across 39 transactions representing 3,272 total units sold. Arizona-based investors, led by HSL Properties (368 units) and Farnam Realty (183 units) were the dominant buyers of multifamily properties in the Tucson area accounting for 32% of total units transacted, or 1,040 units. Texas-based investors, led by new market entrant ComCapp, came in 2nd with 887 units purchased, and rounding out the top three was California-based investors who purchased the 882 units. Sales of 100+ unit properties witnessed a sizeable 131% y-o-y increase to $222.1 million, with average Price Per-Unit (PPU) amount increasing 7% to $87,060. Whereas 100+ unit properties saw a sales volume increase, 10 to 99 unit properties saw a volume decrease of (31%) to $51M with a 5% increase in average PPU amount to $70,545. The Tucson MSA did not have any new deliveries in 2Q 2018. In fact, Tucson will not see any new construction deliveries until late 2018, aside from smaller (sub-50 unit) student and affordable housing developments. Accordingly, Occupancy Rate for the MSA increased 10 bps to 94.5%, still well above Tucson’s 10-year average Occupancy Rate of 91%. Average rent continued its rise increasing 4.1% y-o-y to $831.
INSTITUTIONAL INVESTORS LEAD THE WAY
As Oliver Senchal noted in the forward to Preqin’s Real Estate Funding 2Q report, “concerns over a downturn are still evident, not only from the increase in appetite for debt funds we have seen in recent years and the downside risk protection they offer, but also from the mandates that institutional investors are putting out. Indicators appear to be moving from opportunity funds down the spectrum towards value added and core-plus vehicles.” In fact, value add funds accounted for ~66% of fund closures and capital raised with the majority of those funds focused on North America. What’s driving investor interest in Tucson? Primarily sustained jobs, 2.1% y-o-y increase and continued population growth. Major job / economic development announcements for the area include Amazon’s new warehouse development which is set to bring 1,500 new jobs to the region, as well as, GEICO’s regional office expansion (700+ jobs) and, a yet-to-be identified, new corporate entity looking to expand into the region and bring hundreds of high paying jobs.
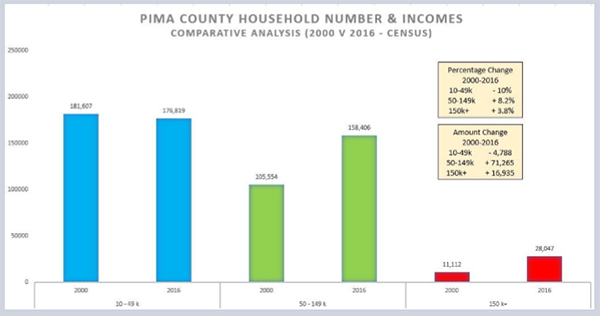 In regards to incomes, and referenced in the chart, Pima County has witnessed a significant increase in households earning above $50K with the largest percentage increase, rising 8.2% from 2000 to 2016, in those households earning between $50 to 149K.
The 2-year/10-year spread refers to the divergence between the 2-year Treasury note and the 10-year US Treasury bond. Generally speaking the yield on the 10year should be greater than the 2-year based simply on the fact that more adverse economic events are likelier to transpire over a longer timeframe than a shorter one. Why all the noise? During the past three recessions, the 2/10 spread went negative about a year before the onset of the economic slowdown; which, as far as economic indicators go, has been as prescient an indicator as we’ve had over the last several decades. As of July 31st, the 2/10 spread was a mere 32 bps.
Despite the long list of notable bond trading detractors who firmly believe in the prescience of the 2/10 spread as the true market indicator, I tend to agree with traders such as John Mauldin, MauldinEconomics.com, or Kevin Muir, TheMacroTourist.com, who assert that given massive Central Bank QE (Quantitative Easing), and real negative rates, has rendered the spread less effective. I would further assert, not only has it made the spread less effective it has also distorted R-star or natural rate of interest. Given the past decade of zero-to-negative interest rates the entire developed world over, central banks have artificially thrust R-star downward causing investors, whether knowing or unknowingly, to increase risk in order to attain greater yields. I still believe we are closer to negative rates than we are to 4%+ rates. Why do I think this? Given the length of our current recovery, second longest on record, we are probably closer to a correction than continued expansion. The caveat emptor, current growth has been spurred by tax cuts and deregulation which could certainly extend the bull market’s rally longer than what many are predicting. Nonetheless, in previous recessions central bankers have, on average, needed to cut interest rates ~5% before normalizing policy. Given the Fed’s current 1.5 to 1.75% target, with two more rate hikes expected this year moves the target to 2 to 2.25%, negative rates could certainly be on the horizon. Final question/thought, suppose real estate return rates mean revert to average historical levels of 3.8%, across the board, and average rental rates soften to 2%+, contingent upon market, where else are you going to find a better return? Investors are slowly beginning to wake up to this new market reality and, my best guess without the benefit of a future indicating magical crystal ball, is that multifamily is where they will want to be.
Full report is here: ABI-Multifamily-Tucson-MSA-2Q-2018-Quarterly-Report
DATA SOURCES: ABI Research / Bureau of Labor Statistics / Census Bureau / YARDI Matrix / Vizzda / US Chamber of Commerce / RED Comps / ARMLS